Ensuring your graphs are honest
11/23/16 / David Kennedy

For our firm, the very idea of fake news goes against our mission to:
Provide accurate and unbiased information and counsel to decision makers.
The realm of fake news spans the spectrum of misleading to outright lying. It is the former that got us thinking about how graphs are sometimes twisted to mislead, while not necessarily being wrong.
Below are four recommendations to prevent misinterpretation when making your own graphs (or things to look for when interpreting those seen in the news).
1. Use the same scales across graphs to be compared
Showing similar data for different groups or from different times? Make the graphs the same scale to aid easy, accurate comparisons.
Take the below examples. Maybe you have two graphs, even on separate pages, used to illustrate the differences between Groups 1 & 2. If someone were to look between them to see differences over time, the visual wouldn’t depict that 2016 saw a doubling of the proportion who “agreed.” The bar is slightly longer, but not twice as long.
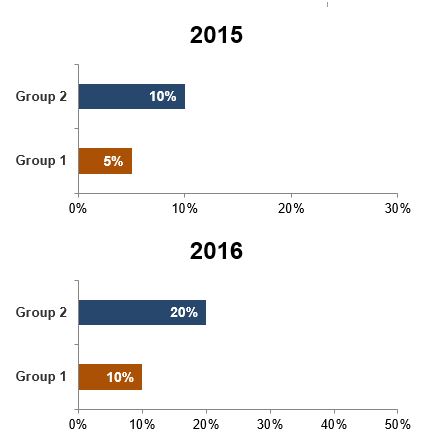
Sure, including axis and data labels helps, but the benefit of a graph is that you can quickly see the result with little extra interpretation. Poorly designed graphs, no matter the labeling, can still mislead.
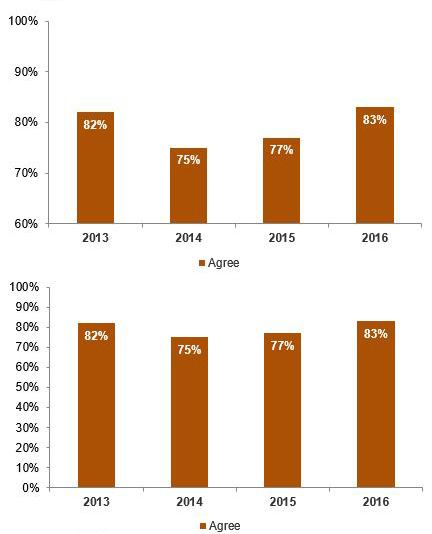
2. Start the graph origin at zero.
Similar to above, not starting the graph at a zero point can cause differences to be taken out of scale.
In the below examples, both graphs show exactly the same data but start from different points, making the differences in the first graph look proportionately larger than they are.
3. Convey the correct magnitude.
Sometimes, a seemingly small amount may have significant meaning (think tenths of a degree in global temperatures), while sometimes a large amount may not (think a million dollars within the Federal budget).
Choosing the proper graph type, design, and what to actually graph all make a difference here.
For example, when graphing global temperatures, graphing the differences may best accentuate the magnitude rather than graphing the actual temperatures, where the relatively small-looking differences fail to communicate the finding.
4. Make it clear who is represented by the data.
Does this data represent the entire population? Only voters? Only likely voters? Only those who responded “yes” to a previous question? Only those home on a Thursday night with a landline? (If it’s the latter, save your time and just ignore it completely.).
Usually, the safest bet is to show results by the whole population, even if the question was only asked to a subset of people due to a skip pattern. This is easiest for people to mentally process and prevents accidentally interpreting the proportion as the whole.
For instance, if 50% of people who were aware of Brand A had seen an ad for the brand, but only 10% of the population were aware of Brand A in the first place (and, therefore, were asked the follow-up about ads), then in reality, probably only 5% of the population has seen the ad. To the casual reader, that subtle difference in who the results represent could be significant.
This, of course, isn’t our first time writing about graph standards. Checkout some of our other blogs on the subject here: