Predictable Unknowns
11/4/16 / Matt Bruce

Have you ever needed to know what the future will look like?
To create great strategic plans, our clients need to understand what their operating environment will look like in five, ten, or thirty years. They want to know how the population, jobs, markets, homes, and infrastructure are expected to change. We help these clients by providing reliable projections, often through analysis of preexisting data. Although we have no crystal ball that tells us exactly what the future holds, we can point clients in the right direction. Here are a few ways we look at trends and projections to help solve our client’s problems.
Patterns from the Past:
We frequently commence research projects by reviewing the current population profile and looking for patterns from the past that show how we got here. A common way we do this is by mining demographic data from the U.S. Census. We access tons of demographic estimates across a wide variety of geographies, such as zip codes, census tracts, towns, cities, counties, metro areas…you get the idea. The amount of demographic information available is amazing. While examining demographics is a cost-effective way to start to understand an area or population, there are critical limitation to demographics. Data are a year or two years old by the time they are available to the public. More importantly, there is a problem assuming the future will represent the past. Demographics can get us started, but when we want to peer into the future, we move to other sources.
Forecasting the Future
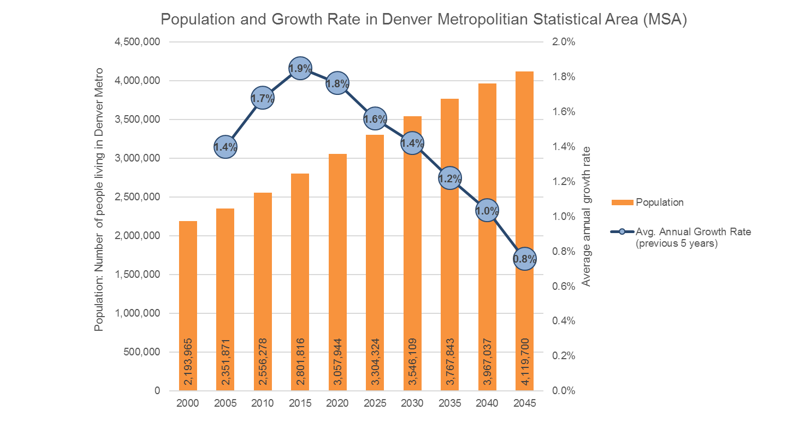
Several data sources project key variables such as population, jobs, age profiles, homes, and transportation. A good source for population projections in Colorado is the State Demography Office. From this website, we can align previously collected population data with future projections to provide a nice continuation from past, to current, to future population trends. Further, we can break apart the population trend with age profiles that show changes by generation. We can create such analyses at the state or county levels or any region comprised of counties. For example, below is the population of the Denver Metropolitan Statistical Area (MSA), which is comprised of ten counties (Adams, Arapahoe, Broomfield, Clear Creek, Denver, Douglas, Elbert, Gilpin, Jefferson, and Park). You can see the rate of growth in Denver Metro is projected to steadily slow, although remain positive, from 2015 to 2050.
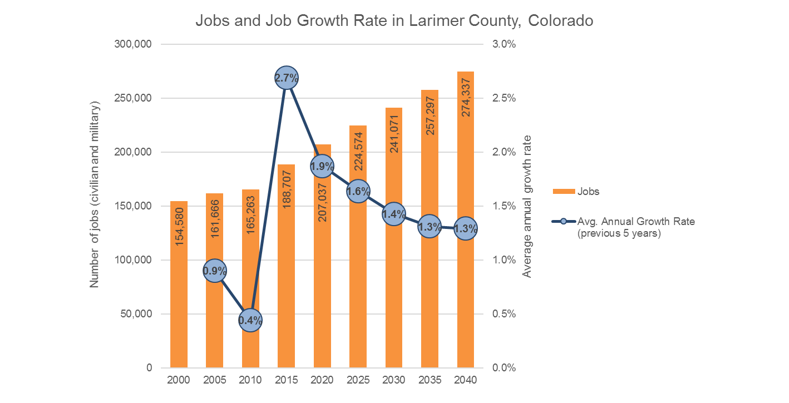
Sometimes our clients are more interested in understanding the future of job growth, including how many jobs are expected, what type of jobs, and where they will be located. We use a few different sources to answer these questions. If we are working in Colorado, we pull down job forecasts by county or region. For example, here is the forecast for total jobs and job growth rate for Larimer County, Colorado.
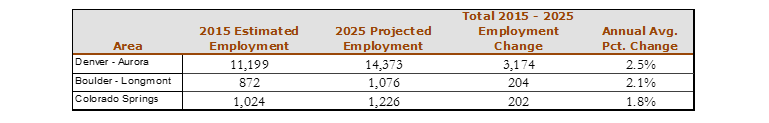
Other times, our clients would like more detail than total jobs. We pull occupation forecast data from the Colorado Department of Labor and Employment. This website provides current and projected occupations by various geographies including counties and metro areas. For example, a law school marketing department might be interested in projections of the number of lawyers working in various areas in Colorado. The following table shows that the growth rate of lawyers is expected to be slightly higher in Denver-Aurora Metropolitan Area than in Boulder or Colorado Springs.
These are just a few examples of how we have helped our clients look at the past as well as understand what the future might look like. Of course, many clients have questions that are not so easily answered by secondary data that is already available. In these cases, we build our own models to measure and predict all sorts of estimates, such as demand for child care, business relocation, and commuting patterns.
If you need to understand what the future might bring to your organization, give us a call and we will see how Corona can help solve your problem.