Total Trivia Crack Scores by Game and Duration – The final post is a series of blogs analyzing Trivia Crack
5/15/15 / Kevin Raines

We looked at total Trivia Crack scores in our previous blog of this series, and now we’ll close up by delving a little bit deeper. Because, you see, not all Trivia Crack games are the same.
In our methodology section (Blog 4 of this series), we made a comment that players in one-on-one games tend to have higher scores than players in challenges. Let’s take a look at that comparison. (These graphs are also mathematically smoothed to enhance readability.)
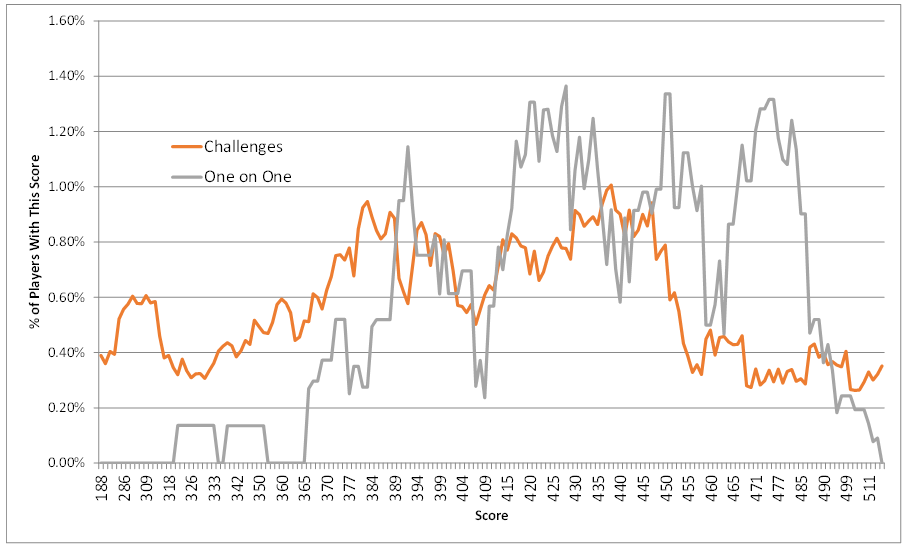
We can see that Challenge gamers are far more likely to have scores below approximately 390, while One on One gamers are more likely to have scores in the 410 to 430 range, and far more likely to have scores in the 460 to 490 range. Interestingly, you’re more likely to encounter the elite players with scores over 490 in Challenge games, which runs counter to the pattern.
Overall, the median score for Challenge gamers is 411, while the median score for One on One gamers is 434. This is a pretty big difference, because it means that the average One on One gamer is scoring about 4 points higher in each of the six categories.
And as we close out our analysis of Trivia Crack, we’ll take one final look at stamina. If you’ve made it through all nine blogs in this series, you’re probably interested in that.
In our fourth blog on methodology, we examined how scores change as people answer more questions. Our competing theories were that more frequent players may have higher scores because they’re good at the game and having fun, or they may have lower scores because it’s hard to maintain consistent high scores over time. In that blog, we showed that scores actually tend to be higher as players answer more questions, rising approximately 6 points (1 per category) for every 1,000 questions answered. So our theory was proven that stronger players play more often.
But actually, both theories are true. When we examine the score distribution, we find that players are much less likely to have elite scores as they answer more questions.
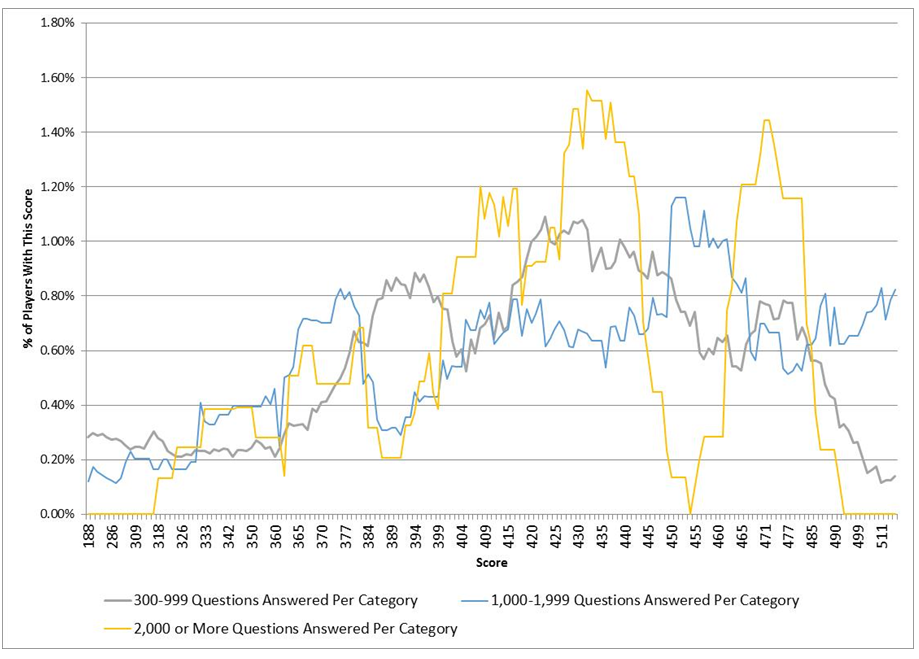
The three smoothed curves below show the distribution of scores of players who have answered differing numbers of questions per category, with the yellow bar showing the most frequent players and the gray bar showing the newer or less frequent players. If you look at the far right side of the graph, you’ll note that we had no frequent players in our sample who scored more than a 495, while a small percentage of our newest players did. While it may be a statistical fluke it would appear that it’s difficult to maintain an ultra-high score as one plays more and more games.
If that’s the case, though, why do we see average scores rise as more games are played? The answer may lie in two places on the graph. First, we can take a look at the middle (blue) bar of those who have answered between 1,000 and 2,000 questions per category. These people are quite strong, with a notable percentage having scores exceeding 490. And second, we can see in the most veteran players (yellow bar) that a goodly proportion are well above average, with scores ranging from 460 to 490.
And with that, we conclude our examination of the game of Trivia Crack. If you want to challenge me, look me up at @kevin.802.562 and we’ll make a game of it. But I have to warn you, we take the “Bright Thinking, Brilliant Guidance” motto seriously at Corona Insights, so be prepared for a battle.
- Previous Post / The Lifesavers Conference
- Total Trivia Crack Scores – The eighth in a series of posts analyzing Trivia Crack / Next Post
“Interestingly, you’re more likely to encounter the elite players with scores over 490 in Challenge games, which runs counter to the pattern.”
Because for these players, winning the friends challenges is a great source of coins. Players at that level can win far more than their share of challenges and rack up coins in the process, which helps them win even more challenges, or helps them dominate in 1 on 1 games.
Ha. You’ve discovered this strategy, too. It’s a bit of a system flaw. If you’re a strong player, your expected value of coins is very high in the friends challenges, which you can then use to become an even stronger player. I feel a little guilty about it, but not guilty enough to stop doing it. Plus, as one of the stronger players I sometimes feel guilty about initiating a 1 to 1 challenge because I feel a little like a schoolyard bully if I draw someone who isn’t as strong.
Hey Kevin! Love your analysis, and also would love to challenge you to a game. But I’m not finding that exact address at Trivia Crack. Did you change it?
Hmm, I just looked it up and that’s my correct profile. What’s yours and I’ll see if I can find you. I’ve never looked someone up for a challenge before, so this will be a learning experience.
Thank you for doing this! I’ve often wondered how I was doing, compared to other players. Now, with your total score grid , I can see for myself that I’m not so bad! (503 total points!) I hope I can get my swollen head through my front door! Lol !
Kevin, I really liked reading all of your posts. Great analysis of my favorite trivia game. Is interesting to see where I fall on relationship to the rest, something I have always wondered.
I copy and pasted your @kevin.802.562 as I started a new game with Friends and it worked.
Going to challenge you. @magjr1979
Thanks!
Bring it on, my friend! I’m ready.
(And in a moment of bragging, my geography score kicked up to 93 today. It’s been at 92 since the Kennedy administration, never moving. But I guess it’s been creeping slowly upward. We’ll see if I can keep it there.)
These stats seem to be off, I currently am at level 183, and I score 562 in total (Science – 96, History – 95, Arts – 94, Geography – 94, Sports – 92, Entertainment 91). I seem to see players with a similar profile to me. Will you be doing an update of your statistics? Just curious.