Total Trivia Crack Scores – The eighth in a series of posts analyzing Trivia Crack
5/14/15 / Kevin Raines

In our previous six Trivia Crack blogs, we’ve taken a look at each of the individual categories as well as talking a bit about the methodology of collecting and analyzing scores. Now let’s move on to the capstone of our little Trivia Crack project, which is a look at total scores.
We calculated total scores by simply adding the scores of each of the categories together. Here’s the distribution that we saw. Note that this graph includes a smoothing algorithm or otherwise it would be incredibly jagged and hard to read.
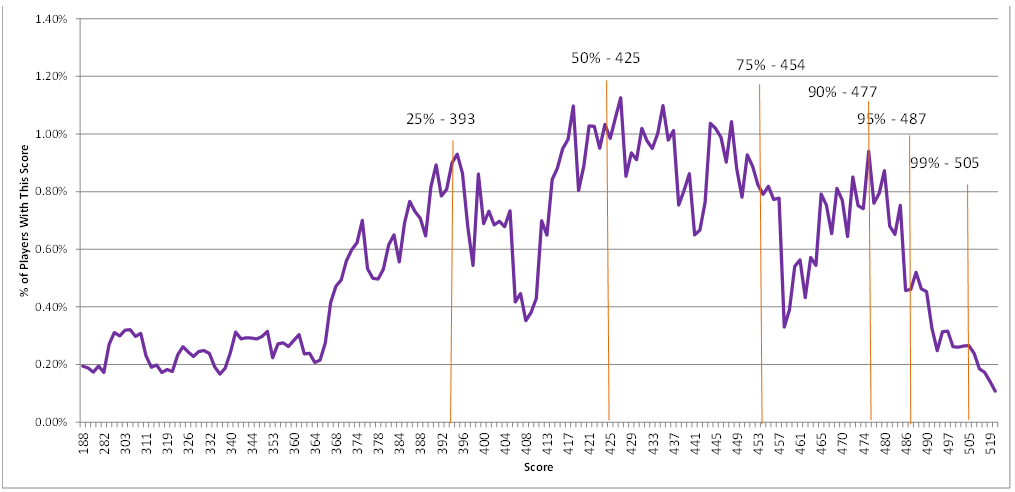
From the above graph, we see that it takes a score of 393 to rank about 25 percent of Trivia Crack players, and a total score of 425 to rank in the top half. The top 10 percent of players are scoring 477 or higher, and if you want to be a 1 percenter you’re going to need a 505 or higher. Good luck!
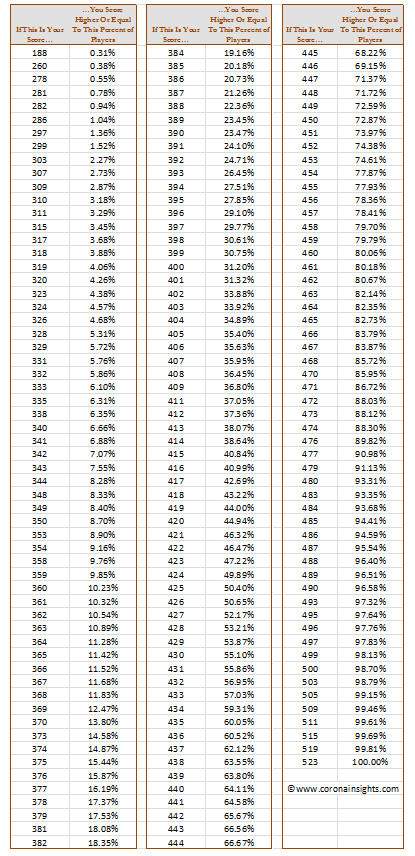
If you’d like to know exactly where you stand, you can check out the following table for exact scores.
- Previous Post / Total Trivia Crack Scores by Game and Duration – The final post is a series of blogs analyzing Trivia Crack
- The Arts Category – The seventh in a series of posts analyzing Trivia Crack / Next Post
“If you’re good at Arts, does that predict that you’re a good overall player?”
“If you’re good at History, does that predict that you’re a good overall player?”
etc.
looks like you forgot to include the correlation between final scores and category scores. as for the doing better the more you answer bit, it comes down to memorizing to some extent the questions (such as knowing when they talk about primary colors they mean with paint and not light, etc.).
Hi James,
Actually, I did do that correlation, but I posted it in each of the individual category blogs instead of this post about total scores. It’s kind of buried in the text in those blogs, so yeah, I probably should have summarized it here, too.
I agree that there’s definitely an advantage to learning the styles of the questions over time. I thought a stronger impact might simply be that stronger players will enjoy the game more and play more games over time. While there’s definitely an upward pattern in scoring as people play more (see my fourth blog in this series), it wasn’t as large as I would expect. But that could change over time, too, as the game ages in the U.S. market.
I just wanted to let you know that I came upon your site/information after playing Trivia Crack for several weeks. Being that I am ultra-competitive and always wanting to compare myself with others to see how I match up (or generally don’t match up) I found your site to be a tremendous amount of research. After playing the game for almost three months and sporadically checking your site I have finally attained the top 1% (damn Arts took forever for me to get that score up to 81%). I really appreciate this resource and I will reference this when I come across an opponent that really challenges me.
Dave Crissman
Hi Dave,
I was surprised that there wasn’t a way to examine one’s scores on the Trivia Crack site, so I set about doing it myself. It was indeed interesting to see how scores vary in the different categories and how I stacked up.
The bad news is that I did this analysis before the gem system came into place. I suspect that it’s led to a bit of inflation in scores, though I’m not sure to what degree.
Looks like I’m a bit atypical. Arts is actually my strongest category (94), but I score above 90 in all categories, for a total score of 550 right now.
Still having fun with this game after more than a year 😉
Kevin,
Thanks for the response to my questions and feedback on how this came about. I am truly amazed by some of the knowledge that others have. I have gotten up to 511, but John from July 5th blows me out of the water. Maybe you could set up a spot on players to find other top players so that they could have similar competitors. I do want to share one anecdote from playing a competitor several weeks ago. I was on vacation and was bored and decided to play a random opponent. I got the lead 3-0 (the maximum that one can get). My opponent played and did not get any of the crowns, then I ran off the remaining questions to win 6-0. This opponent looked like a very good competitor with his/her scores, so I immediately went to play again, because I am always looking for strong adversaries. However, I received a message that I couldn’t play. I just assumed there was a problem so I knew that there was the “chat” component of the game (I had never used this prior), but I thought I’d text the opponent see if there was a mistake and if he/she could challenge me. When I got to the chat I received this message, “It must be rewarding to know that you use a computer to get your answers otherwise you wouldn’t be that intelligent. It is so obvious!!!” My initial reaction was to be furious, but then I gloated for a bit that this worthy adversary decided I was cheating. The only long-term frustration was that I didn’t get the final word in because he/she turned off the chat feature. Anyone else with any other similar stories? Thanks again for this great forum. Dave Crissman
Same here, Dave. I typically win 6-0 (winning 90% of my games), and have been accused of cheating, being a “genius”, etc.
Frankly, I think most of the questions are pretty easy 😉 but it’s still fun to play a few times per week.
I may have missed it but in this statistical analysis are the percentiles random and score generalized to all players? I have been playing about 3 months_My total score is currently 521. I play only random players. i win about 90% of all games. i find few people challenge me more than twice. i appreciate the analysis. Fun game.
There’s naturally a selection bias since I did a lot of challenges, and you’re naturally more likely to draw players who play more often. However, I corrected for that with statistical weighting based on the level of the player (i.e., I weighted down the players with more games under their belt).
One potential concern that was raised is how Trivia Crack actually populates challenges. If they’re making decisions other than random assignments, that could impact the types of people that I drew during my games. However, given the distribution of scores that I saw in this analysis, I don’t think that’s an issue.
The comments about cheating accusations are interesting to me. I’ve got pretty high scores but have never been accused of cheating. My theory is that it’s because I have a pretty wide range in my categories, with entertainment trailing the others by a fair bit and geography being pretty high. When I see a player with really high scores, I tend to assume they’re not cheating if they have a big spread by category. The ones that make me suspicious are the players who have very high scores with almost no difference by category. What do others think about this?
I stumbled on your statistical analysis and appreciate the depth of research. I haven’t read the entire design, so possibly I missed the information I am curious about. I would like to know your sample size. I have been playing for several months and my composite score across categories is 529. I am interested to know is the population random, and are your inferences representives of all player within standard parameters. I find few that are close to 90% or 87 % in all categories. I do lose an occasional game. I am having fun, however few random players continue after 4-5 games.