The Power of Ranking
11/24/14 / Beth Mulligan

One of the fun tools of our trade is index development. It’s a way to rank order things on a single dimension that takes into account a number of relevant variables. Let’s say you want to rank states with respect to their animal welfare conditions, or rank job candidates with regard to their experience and skills, or rank communities with respect to their cost of living. In each of these cases, you would want to build an index (and indeed, we have, for several of those questions).
Index-based rankings are all the rage. From the U.S. News & World Report ranking of Best Colleges to the Milliken Institute’s Best Cities for Successful Aging, one can find rankings on almost any topic of interest these days. But these rankings aren’t all fun and games (as a recent article in The Economist points out), so let’s take a look at the stakeholders in a ranking and the impacts that rankings have.
- The Audience/User. Rankings are a perfect input for busy decision makers. They help decision makers maximize their choices with very little effort. As such, they influence behavior, driving decisions about where to apply to college, whom to hire, where to go on vacation, where to move in retirement, and so on. But if the rankings are based on different variables than are important to the users, users can be misled.
- The “Ranked”. For the ranked, impacts reflect the collective decisions of the users. Rankings impact colleges’ applicant pools, cities’ tourism revenues, and local economies. And on the flip side, rankings influence the behavior of those being ranked who will work to improve their standing on the variables included in the index. As the old adage goes, “what gets measured gets done.”
- The “Ranker”. The developer of the index holds a certain amount of power and responsibility. There are both mathematical and conceptual competencies required (in other words, it’s a bit of a science and an art). The developer has to decide which variables to include and how to weight them, and those decisions are often based on practical concerns as much or more than on relevance to the goal of the measurement. (There is usually a strong need to use existing data sources and data that is available for all of the entities being ranked.) Selecting certain variables and not others to include in the index can have downstream impacts on where ranked entities focus their efforts for improvement, even when those included variables were chosen for expediency rather than impact.
To illustrate, I built an index to rank “The Best Coffee Shops in My Neighborhood.” I identified the five coffee shops I visit the most frequently in my neighborhood and compiled a data set of six variables: distance from my home, presence of “latte art,” amount of seating, comfort of seating, music selection, and lighting.

My initial data set is below. First, take note of the weight assigned to each variable. Music selection and seating comfort are less important to my ranking than distance from home, latte art, amount of seating, and lighting. Those weights reflect what is most important to me, but might not be consistent with the preferences of everyone else in my neighborhood.
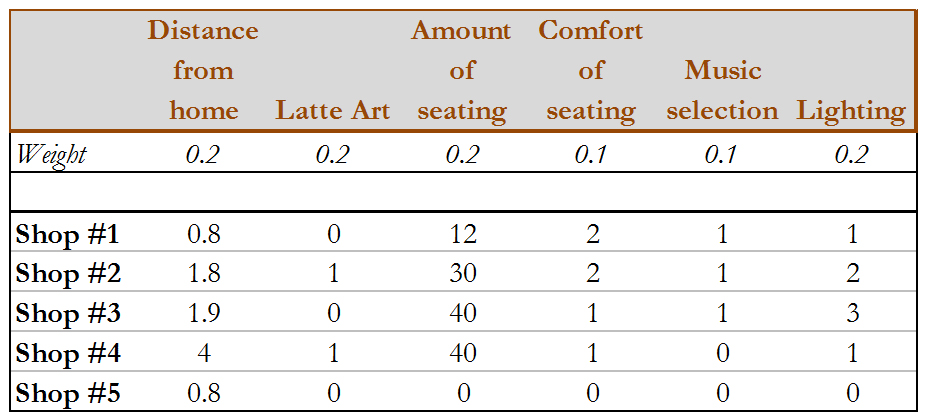
Next, look at the data. Distance from home is recorded in miles (note that smaller distances are considered “better” to me, so this will require transformation prior to ranking). Latte art is coded as present (1) or absent (0). This is an example of a measure that is a proxy for something else. What is important is the quality of the drink, and the barista’s ability to make latte art is likely correlated with their training overall – since I don’t have access to information about years of experience or completion of training programs, this will stand in instead as a convenience measure. Amount of seating is pretty straightforward. Shop #5 is a drive-through. Seating comfort is coded as hard chairs (1) and padded seats (2). Music selection is coded as acceptable (1) and no music (0). Lighting is coded as north-facing windows (1), south-facing windows (2), and east- or west-facing windows (3), again, because that is my preference.
After I transform, scale, aggregate, and rank the results, here is what I get.
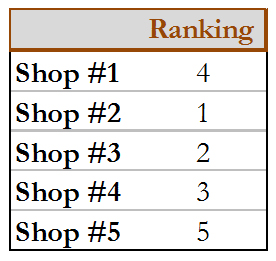
These results correspond approximately with how often I visit each shop, suggesting that these variables have captured something real about my preferences.
Now, let’s say I post these rankings to my neighborhood’s social media site and my neighbors increase their visits to Shop #2 (which ranked 1). My neighbors with back problems who prefer hard seat chairs may be disappointed with their choices based on my ranking. The shop owners might get wind of this ranking and will want to know how to improve their standing. Shops #3 and #5 might decide to teach their employees how to make latte art (without providing any additional training on espresso preparation), which would improve their rankings, but would be inconsistent with my goal for that measure, which is to capture drink quality.
With any ranking, it’s important to think about what isn’t being measured (in this example, I didn’t measure whether the shop uses a local roaster, whether they also serve food, what style of music they play, what variety of drinks they offer, etc.), and what is being measured that isn’t exactly what you care about, but is easy to measure (e.g., latte art). These choices demonstrate the power of the ranker and have implications for the user and the ranked.
Perhaps next we’ll go ahead and create an index to rank Dave’s top ski resorts simultaneously on all of his important dimensions.
What do you want to rank?