Conducting a Data Audit
12/10/23 / Paul Collier

This is the final blog in a three part series on how you, as a nonprofit leader or contributor, can maximize your organization’s existing data assets. Part I of this series explored the foundational piece of this work – building your team’s data literacy; part 2 of the series explored another key piece of this work – creating your organization’s learning agenda.
A data audit is a catalog and critical review of your organization’s data collection activities. This helps to map your current data collection activities to what you need to know and it also tells you what gaps exist. A data audit in itself is a lay of your data collection landscape. So often, new collection activities are layered on over time; it’s helpful to take a critical look at the big picture once in a while.

What are all of the different data points and information coming into your organization right now? A data audit can help people in your organization understand why you are collecting so many data points because it connects the dots between what data is collected and the purpose or use of that data. Similarly, you can see where duplicative data collection is happening and correct as needed.
There are seven general steps to this process, which are outlined below:
1. Identify your scope. In thinking about scope, ask yourself: are we looking at one program, a specific part of that program, or all the programs in your organization? Most of my clients are smaller organizations, so my scope is often organization-wide. Of course, you’ll want to choose the appropriate scope for your organization’s needs and work.
2. Identify what data sets are currently collected. Data sets could be collected in a variety of ways, such as: program applications, participation demographic or intake forms, evaluation tools, meeting or case notes, assessments, surveys, quality assurance checks, or other records. You will want to brainstorm and think through all of these possible areas of data collection. If you are the person tasked with completing the data audit, you’ll probably need to talk with other team members to ask what information they are collecting.
To organize what you learn, consider keeping a spreadsheet where each row represents one dataset. Ultimately this spreadsheet will outline what different data sets are collected, where they are stored, and how they are used. For example:
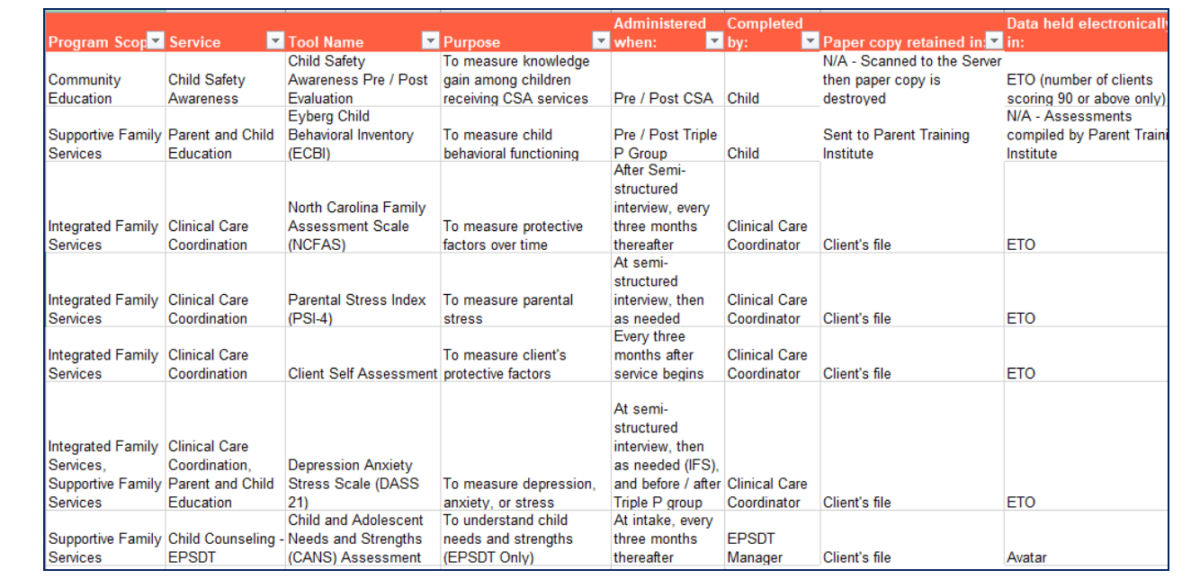
3. Identify where each data set is stored. Next, you will want to think about both electronic and physical storage. For each data set, note where the physical and electronic storage occurs. Some considerations are:
- If we have paper forms, where are the filing cabinets?
- If paper forms, do we want to transfer these to electronic files?
- Which comes first – paper or electronic versions? How does one get converted to the other?
- Is electronic data stored on a shared drive or a personal computer? Is it in a database or some other application such as a mass email tool or communications tool?
Asking these questions helps us understand what electronic recordkeeping systems are in place.
4. Identify how each data set, in general, is used. This is where conversations and having a good rapport with members of your team is important. Often I’ve found that different team members will have different, unique uses for the same data set that not everyone on the team will realize. For example, the evaluation person on your team cares about an intake form because it contains important demographic information about participants. In contrast, the office administrator cares about the intake form because it includes contact information for each participant served by the organization, and can help that person reach out to them. Record the uses for each data set, including anything you learn about how different stakeholders use the same data in different ways.
5. Critically review across data sets (for duplicative data points and gaps). Now that you’ve completed your Data Audit spreadsheet, review it to see what datasets serve a similar purpose. You may find that two or more datasets serve the same general purpose – keep these in mind as the next step will be to go into more depth in those areas. One additional strategy that might be useful here is to compare the datasets to your organization’s Theory of Change. A Theory of Change shows the outcomes your organization is trying to help people achieve, and the activities that lead to those outcomes. Ask yourself:
- Do we have a data set that corresponds to each of these outcomes? (This is a common area for gaps.)
- Do we have a place where we are collecting this data electronically, so it is easy to compile?
- Are there places where the same kinds of questions are asked twice? (It is common that the same demographic and contact information is asked to clients in the intake form and in a survey.)
6. Review priority data sets. This step involves going question by question and field by field for a smaller number of data sets, as well as looking at the actual responses your organization has received. Let’s say that you have identified fifteen different data sources that your organization collects within the context of a program. In step five, you’ve identified a few of these that serve a similar purpose. In this step, you start looking at those priority data sets field by field. Without looking at these data sets in detail, you won’t be able to really understand if duplicative questions exist.
You also want to understand what is happening in practice at this step. If, say you’re only getting responses to a certain question from twenty percent of the people served, then is that information complete enough for you to use in a meaningful way? Sometimes even rarely completed questions can be useful – for example, asking “Is there anything else you would like to share with us?” at the end of an interview or survey. But other times, if most respondents are skipping it you may not be able to use any of the results, and it would be better not to ask.
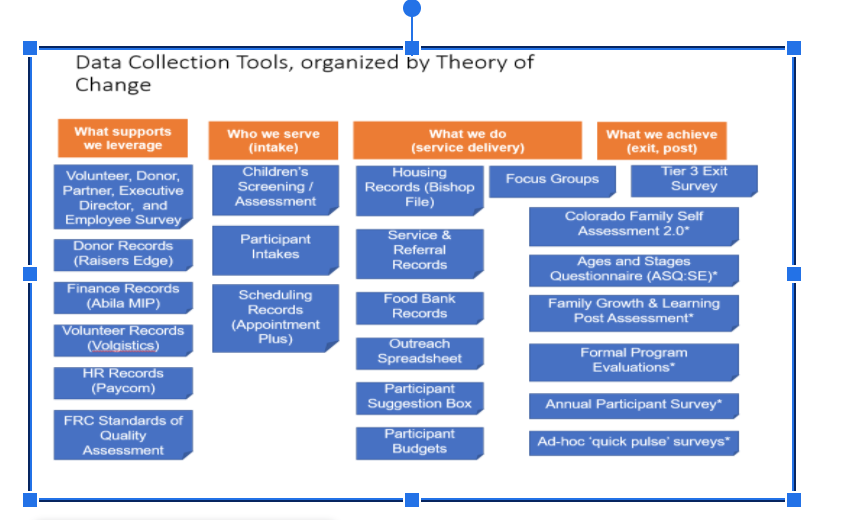
7. Identify opportunities and act. This is the step where you share your findings with your broader team. Often, just coherently communicating what data your organization collects and why can be valuable for others. One approach I often use is to map data sets to an organization’s theory of change.
In the diagram below, each blue box represents a different data source, and the orange boxes represent an element of the Theory of Change. As you can see, there are data collection tools that speak to both what we do (quality and satisfaction) and what we achieve (outcomes of what we do). These were the assessments I reviewed in more depth, as they appeared to fulfill a similar purpose for several different programs.
Sharing out what information your organization collects and why will often spark a robust discussion, and help others understand why certain questions are being asked. This may even lead to ways to simplify what data your organization collects.
I hope that you’ve found these posts useful to understanding how to maximize your nonprofit’s existing data assets. This is the final post in this series, but stay tuned for the next blog.
This post by Paul originally appeared on the Coeffect.co website.