2020 Census Counts for Apportionment Were Razor Thin
4/27/21 / Jim Pripusich


The U.S. Census Bureau has finished initial data processing from the 2020 Census and just published the first results. Last year’s collection found that, as of April 1st, 2020, the number of people living in the United States was around 331 Million or 331,449,281 to be exact. This amounted to a 7.4% increase in the country’s population from 2010-2020 which is lower than the 9.7% increase observed between 2000-2010. The 7.4% growth rate seen over the last decade comes in as the 2nd slowest in the history of the country, just exceeding the 7.3% growth rate observed between 1930 and 1940 as the slowest.
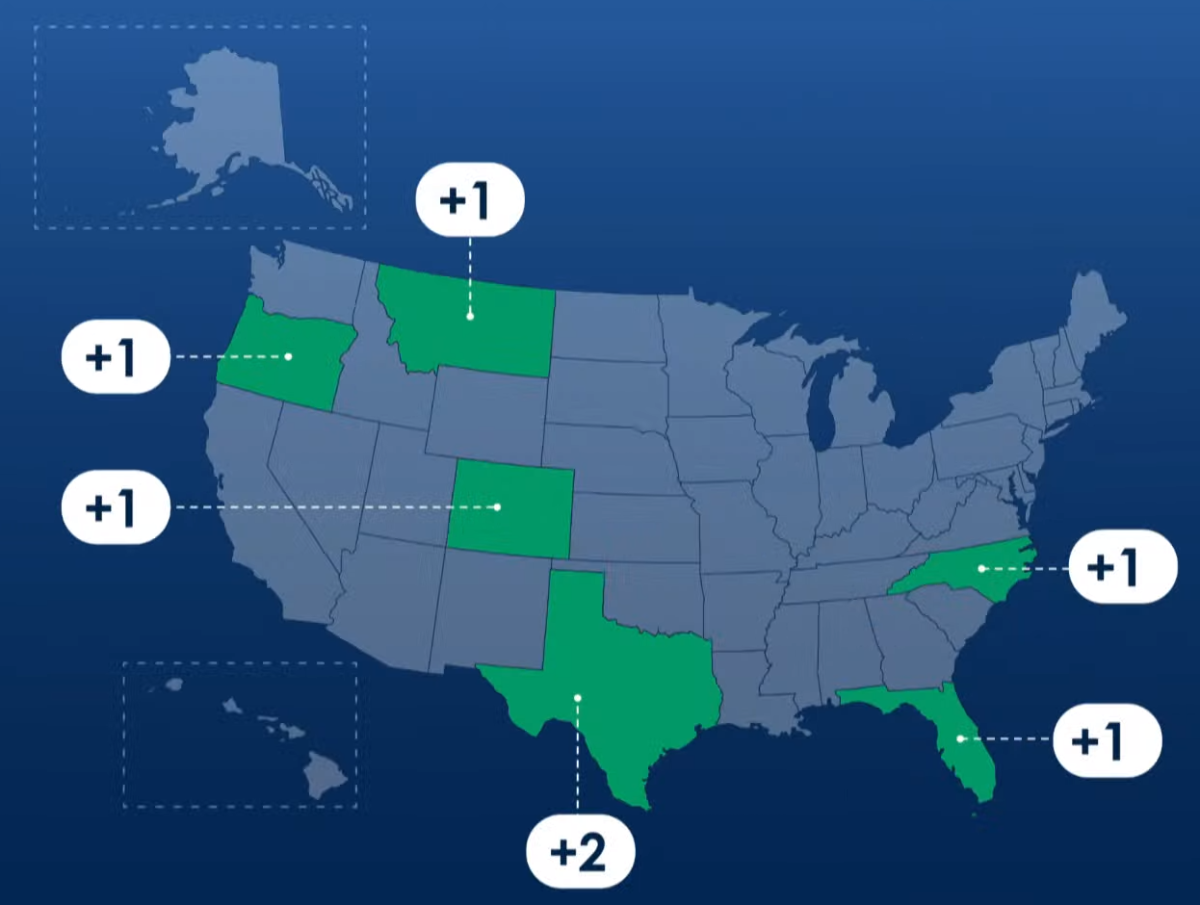
In addition to these top-level numbers, the Bureau also produced apportionment counts that distribute the 435 seats of the U.S. House of Representatives among the 50 states based on population. The data presented will result in seven seats shifting among 13 different states. Five states had populations that grew significantly enough to warrant one additional seat: Colorado, Florida, Montana, North Carolina, and Oregon. Texas’ population increase, compared to the other 49 states, was significant enough to warrant the gain of two seats in the House.
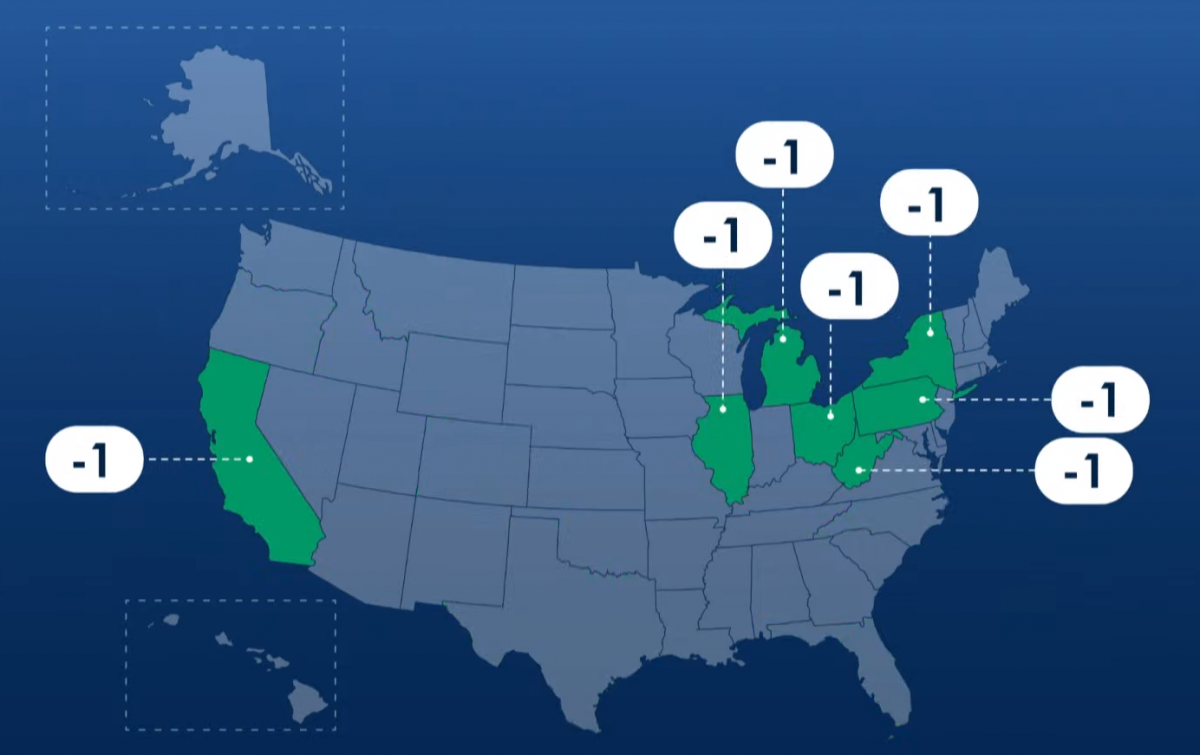
As can be seen in the image below, California, Illinois, Michigan, Ohio, West Virginia, Pennsylvania, and New York all will lose a seat in the House based on the 2020 Census.
The Bureau also published data on the top ten runner-up states that almost gained (or failed to lose) a congressional seat based on the 2020 Census. New York took the honor of being the 1st runner-up state: if all else were equal, the state of New York would have needed only 89 additional people counted in the 2020 Census to have kept its seat in the House of Representatives. In a state with a population of about 20 million, less than 100 people made the difference between New York losing a seat in Congress rather than Minnesota.
This tiny difference is the smallest since the Census started reporting the margin in 1940. In 2000, Utah was the 1st runner-up by 856. In 1970, it was Oregon by 231 people. The fact that such an insignificant difference in population can affect such a significant outcome in representation highlights the importance of the Census Bureau’s fielding and procedures for the Ultimate Survey.