What if the US Senate was a survey sample?
3/16/21 / Jim Pripusich


Diversity (or lack thereof) in the US Senate
After the dust settled from last fall’s elections, many commented on how the 117th congress would be the most diverse ever. While these gains were largely driven by record numbers of women and LGBTQ people being elected to the House of Representatives, we wanted to spend some time assessing the diversity in the upper house that is the US Senate. Fans of American history may be quick to note that the Senate was never designed to be a representative body in the first place. However, we could hope that a chamber whose website self-describes as, “the world’s greatest deliberative body” would look something like the people it has power over. Unfortunately, it does not.
When the 117th Congress convened for the first time in 2021, the Senate had about as many people of color (11) as it did White men named John (9). Despite a record number of female members, only 24 of the chamber’s current 100 are women. At 34 years old, newly elected Jon Ossoff (counted as a John above) is the Senate’s only member under 40. To better understand the lack of representation in the Senate, we wanted to approach the Senate as if it were a survey sample.
What are Survey Weights?
This isn’t the first time we have blogged about survey weights here at Corona. My colleague Beth Mulligan has been blogging about weighting survey data as far back as 2009! In short, survey weights are a statistical correction to rectify imbalances between a survey sample and a population. Weights are generated as an adjustment to ensure that survey responses are more representative of a given population. Let’s consider a simplified example. If a researcher wanted to use a survey to estimate the percentage of adults who used TikTok in Colorado, they would need to ensure that the sample was representative of the various age groups in the state. See some hypothetical data below:
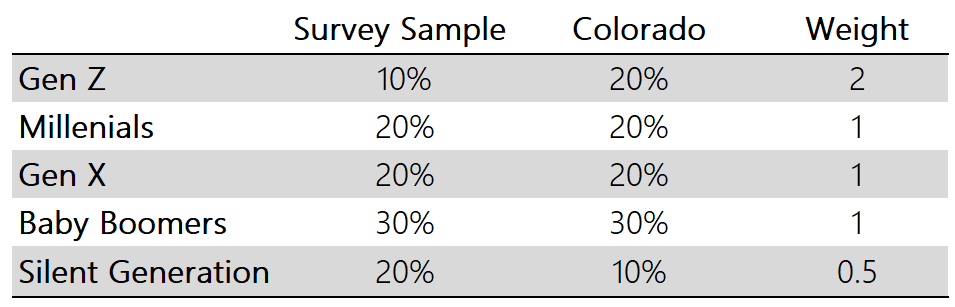
The table above shows that the researcher has oversampled Silent Generation respondents and received too few Gen Z responses to accurately represent the state. If they were to calculate a percentage from this sample without making any corrections, they would likely be underestimating the percentage of Colorado that uses TikTok. The simple correction in this case would be to apply the survey weights listed in the table’s righthand column to any estimates of the population.
We calculate these weights by dividing the percentage of each demographic in the population (in this case Colorado) by the percentage of that demographic in the sample. This would essentially give every Gen Z response twice the power when estimating statistics about the population, while reducing the influence of Silent Generation responses by half. If the percentage of a demographic is the same in the population and in the sample, as it is with the other generations in this example, then the demographic gets a weight of 1. This would mean there is no statistical adjustment for this group. This is just one of many approaches to generating and implementing survey weights. The right weighting strategy depends on what kind of data are available to describe the population of interest.
Survey Weights for The US Senate
Before we start this exercise, it is important to note that something would have gone terribly wrong if a group like the Senate comprised a survey sample. First off, a sample size as small as 100 would make statistical inferences about the population very difficult. Second, this sample is by no means randomly selected. As we will see, the people who comprise the senate are a distinct subsegment of the American population. This exercise is more about using the concept of survey weights to quantify the unrepresentativeness of the Senate.
To weight a survey sample, we need accurate data about the population broken down by key demographics. Often, these data come from the US Census’ American Community Survey (ACS). When choosing demographics to calibrate survey samples, it is important to think critically about what characteristics or traits of the sample need to be adjusted. Adding weight categories can increase margin of error. As such, we want to select demographics that will correlate with the outcomes we care about measuring. For this exercise, we will use the ACS’s data on age, race/ethnicity, and gender. Researchers are often limited to the categories of data that the Census collects and presents. For example, despite growing demands for inclusivity of gender-nonconforming respondents, the Census only collects information on gender in binary male or female categories.
In order to weight the Senate, I pulled data from the 2019 ACS broken out by age, gender, and race categories. I limited the data to individuals aged 30 or above, given that the Constitution stipulates members must be at least 30 years old. The race categories come from respondents self-describing and are broken out into four mutually exclusive categories: White alone, Black alone, Hispanic or Latino, and Not White alone, Black alone, or Hispanic/Latino.
A few important caveats here. First, it is never ideal to combine the cultural and experiential diversity of the racial and ethnic groups that comprise the fourth category. However, we are constrained by the demographics of the Senate in this exercise. Second, the fact that statistical weighting needs mutually exclusive categories inevitably does damage to the full spectrum of racial and ethnic identity. In real life, people do not fit neatly into these boxes. However, unweighted data risks presenting an inaccurate picture of a population if certain racial or ethnic groups are underrepresented in sample data and have distinct attitudes, behaviors, and experiences. As such, researchers often use flawed categories from the ACS and other sources as an imperfect solution to mitigate disparities in sample data.
The tables below show the distribution of Americans 30 and over in contrast to the counts of the individuals that make up the US Senate.
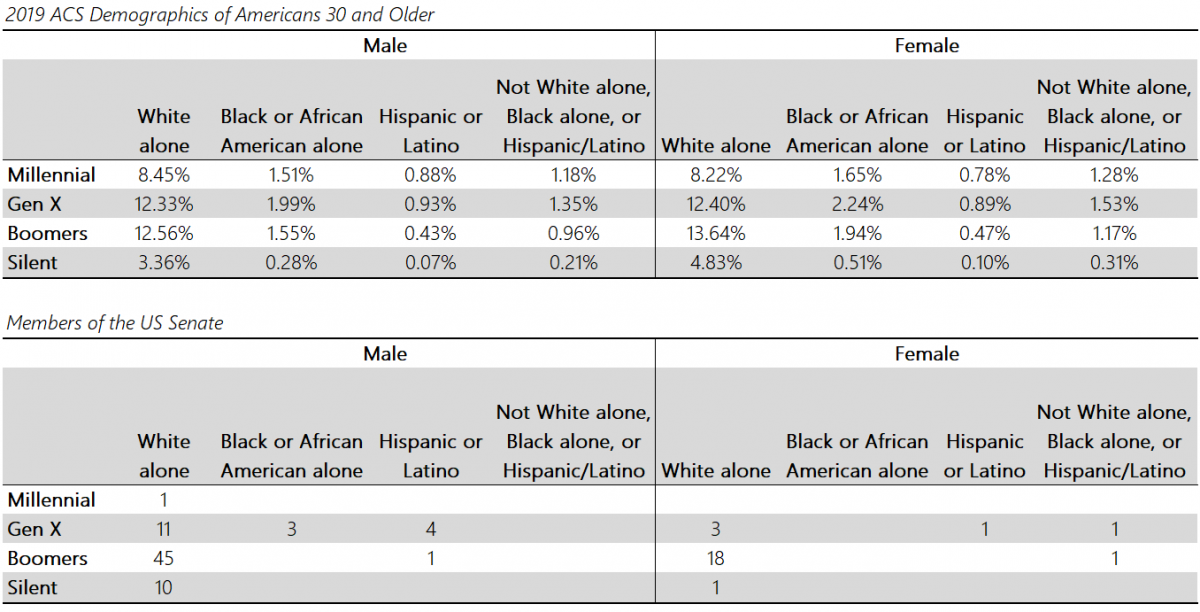
Seeing the distribution of the Senate across age, gender, and race highlights the lack of diversity in the body. If this were a survey sample, we would want to evaluate what was systematically wrong with the sampling strategy and collect more responses from women and people of color. Nearly half the Senate is comprised of White, male, Baby Boomers even though this group only makes up about 12.5% of the country’s population over 30.
The empty cells in the table are a problem when creating statistical weights. To generate weights in this exercise, we will have to combine a series of rows and columns to ensure the sample and population cells are all populated and respectively total to 100%. The tables below show an example of how these cells might be collapsed.
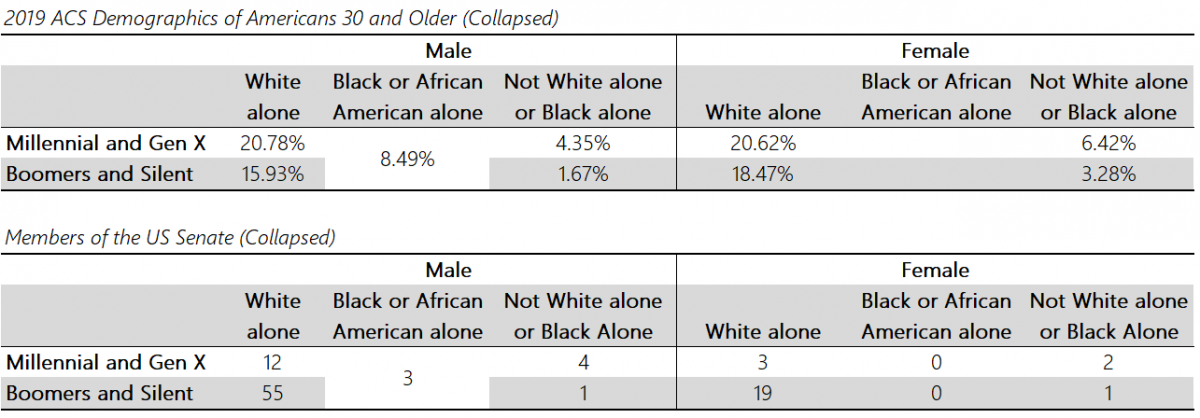
The demographics of the Senate are so far removed from those of the country’s 30+ population that many of the weighting cells needed to be collapsed. I combined the two youngest and oldest generations. The lack of Hispanic representatives and other people of color in the upper house required the combination of two, already reductively defined, racial/ethnic categories. Finally, since there are no Black women in the Senate, we have distributed the percentage of this demographic between two categories: Black or African American alone males, and Not White alone or Black alone females. If this were an actual survey, collapsing cells like this would reduce the representativeness of the unique perspectives that each of these demographics brings to any given topic. This process highlights the massive disconnect between Americans and what kinds of people are elected to the Senate. From these tables we can calculate the weights presented in the table below.

Lessons From the Senate’s Survey Weights
First and foremost, the Senate’s complete lack of Black women members and significant underrepresentation of other people of color and women show that the body is simply unequipped to speak for the diversity of the country. In the end, only two groups were overrepresented in the Senate: White men over 56 and White women over 56. The latter, with a weight of 0.97, nearly mirrored the percentage of Americans. However, there are about 3 times as many White men over 56 in the Senate as there are in the country’s eligible population to be elected to the Senate.
The weights demonstrate how underrepresented Women are in today’s Senate. Despite having the most female members ever, and more than double than the body did just 21 years ago, female voices are still relatively rare in the Senate. Women of color over 29 make up more than three times the American population than they do as a share of the Senate. Younger White women are also significantly underrepresented in the senate. White women aged 30 to 56 were given a weight of 6.87, demonstrating that there are more than six times as many Americans of this demographic eligible to be elected to the Senate than are actually seated in the body today.
The Senate has a long way to go to be more representative of the country. Additionally, the country is becoming much more diverse. About half of America’s post-Millennial population (48%) is Not White. This is compared to 18% of the Baby Boomer generation at the same point in age. About one in four Americans younger than Millennials are Hispanic, compared to only 4% of Baby Boomers when they were the same age. As the country becomes more diverse, our elected representatives must reflect this change. The Senate has a lot of catching up to do.
This exercise also highlights a common problem in survey research. When samples do not collect enough responses from certain demographics, weighting can help mitigate the problem. However, if the response rate is so low among certain groups that distinct demographics need to be haphazardly combined, unique experiences and voices may be lost in the data. Survey researchers have a responsibility to ensure the diversity of populations are captured through effective sampling.