Mapping Racial and Ethnic Diversity in Colorado
2/25/21 / Matt Bruce

My local radio station is holding an essay contest with the theme “A Changing Colorado.” I’ve lived in Colorado my whole life, so the contest got me wondering: How do I think Colorado is changing? It’s certainly easy to see new houses and shopping centers pop up around the Front Range. But what about the people who live here and their life experiences? Those patterns are much harder to see through a windshield, and our anecdotal observations can often be incorrect. I wanted empirical evidence.
Racial and Ethnic Diversity
Although change happens in many ways, I was most interested in exploring racial and ethnic diversity patterns and changes across the state. My standard practice is to rely on data from the U.S. Census Bureau, which is the gold standard of nationally available data on race and ethnicity. Most Census data is available by five top-level individual race categories (Asian, American Indian/Alaska Native, Black/African American, Native Hawaiian/Pacific Islander, and White) plus “more than one race.” Historically, Hispanic/Latino has been categorized separately as an ethnicity. Altogether, there are dozens of ways to categorize and analyze racial diversity. These options and combinations can illuminate the important and complex stories of each population. While I am one who loves this type of nuance, I know that many people are interested in the 10,000-foot view. For that, I often turn to Esri’s Diversity Index.
According to an Esri White Paper, “The Diversity Index captures the racial and ethnic diversity of a geographic area in a single number, 0 (no diversity) to 100 (complete diversity).” Specifically, the number represents the probability that two people living in the same community are from different racial or ethnic populations. The White Paper continues, “If an area’s entire population belongs to one race group and one ethnic group, then an area has zero diversity. An area’s diversity index increases to 100 when the population is evenly divided into two or more race/ethnic groups.”
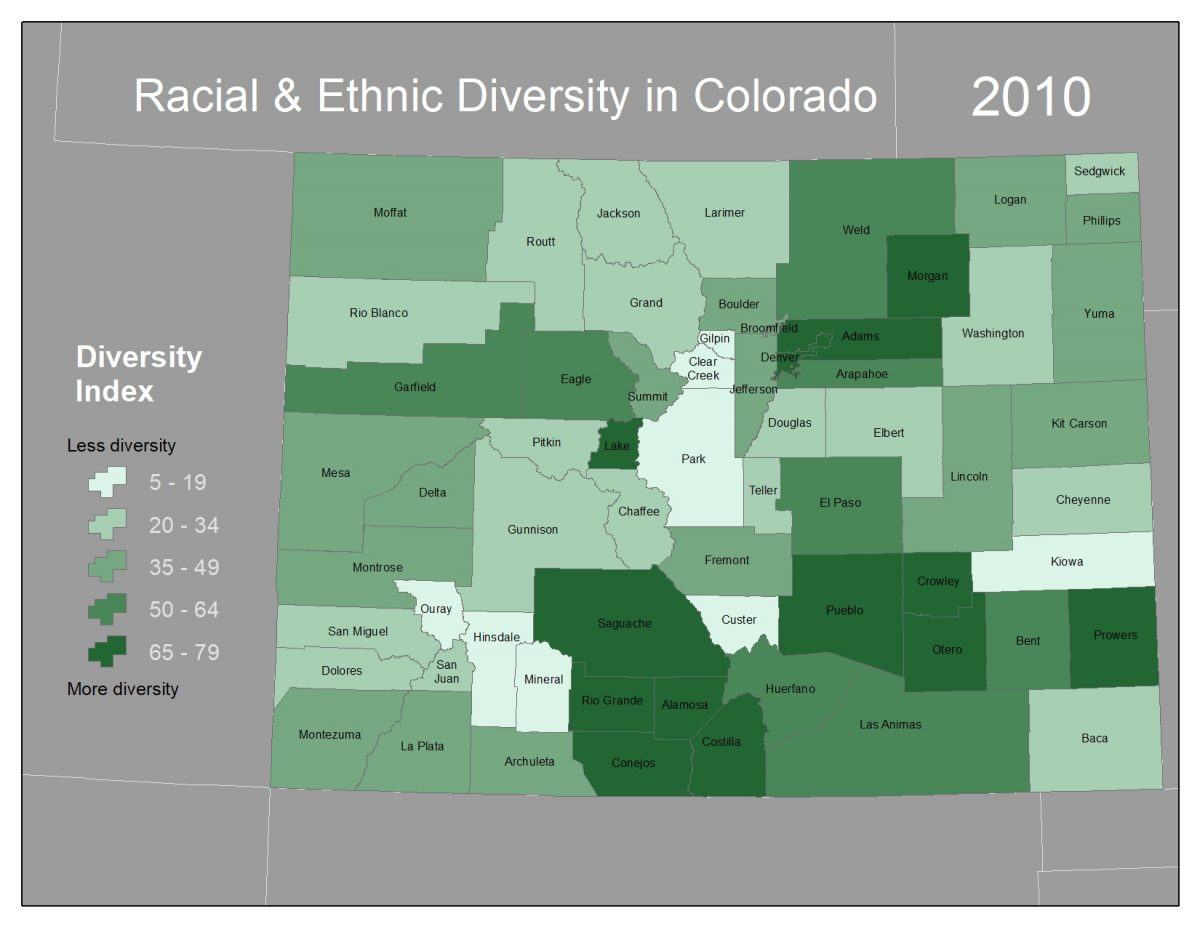
The maps below show the categorized Diversity Index by county in 2010, 2020, and projections for 2025. The light green counties have less racial diversity and the dark green counites have more. My first glance interpretation is that we see four clusters of high diversity intermixed among lower diversity areas. The high-diversity clusters include the Denver Metro Area, the Lower Arkansas Valley (e.g., Pueblo, Otero, Powers counties), the San Luis Valley (e.g., Alamosa, Costilla, Conejos counties), and a more subtle pattern along the I-70 mountain resort communities (e.g., Eagle, Summit, Garfield counties). The low-diversity counties are all rural and have relatively small populations; Hinsdale, Mineral, and Kiowa counties, for example, are among the least populated counites in Colorado.
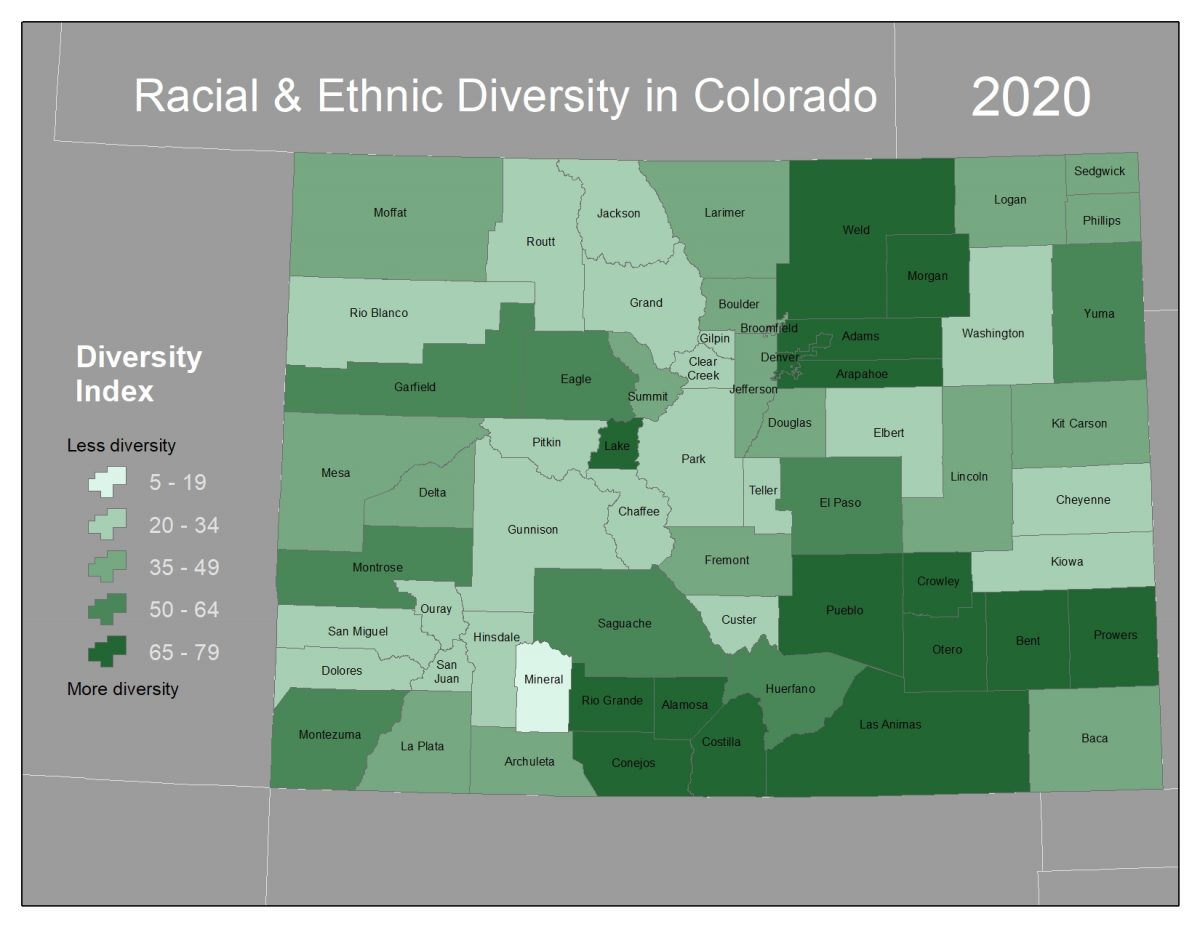
Comparing 2020 (see map below) to 2010, we notice a relatively subtle but consistent pattern of increased racial and ethnic diversity. There are now fewer light green counties; in other words, the rural counties that were least diverse in 2010 increased diversity the most by 2020. This pattern isn’t unique to Colorado. Indeed, rural and micropolitan areas throughout the country have led diversity increases over the past decade.
Additionally, we do see some increases in diversity at the top end. Front Range counties such as Weld, Larimer, Arapahoe, and Douglas all jumped up a tier, as did rural counties such as Las Animas and Bent in the Southeast, and Montezuma and Montrose in the Southwest.
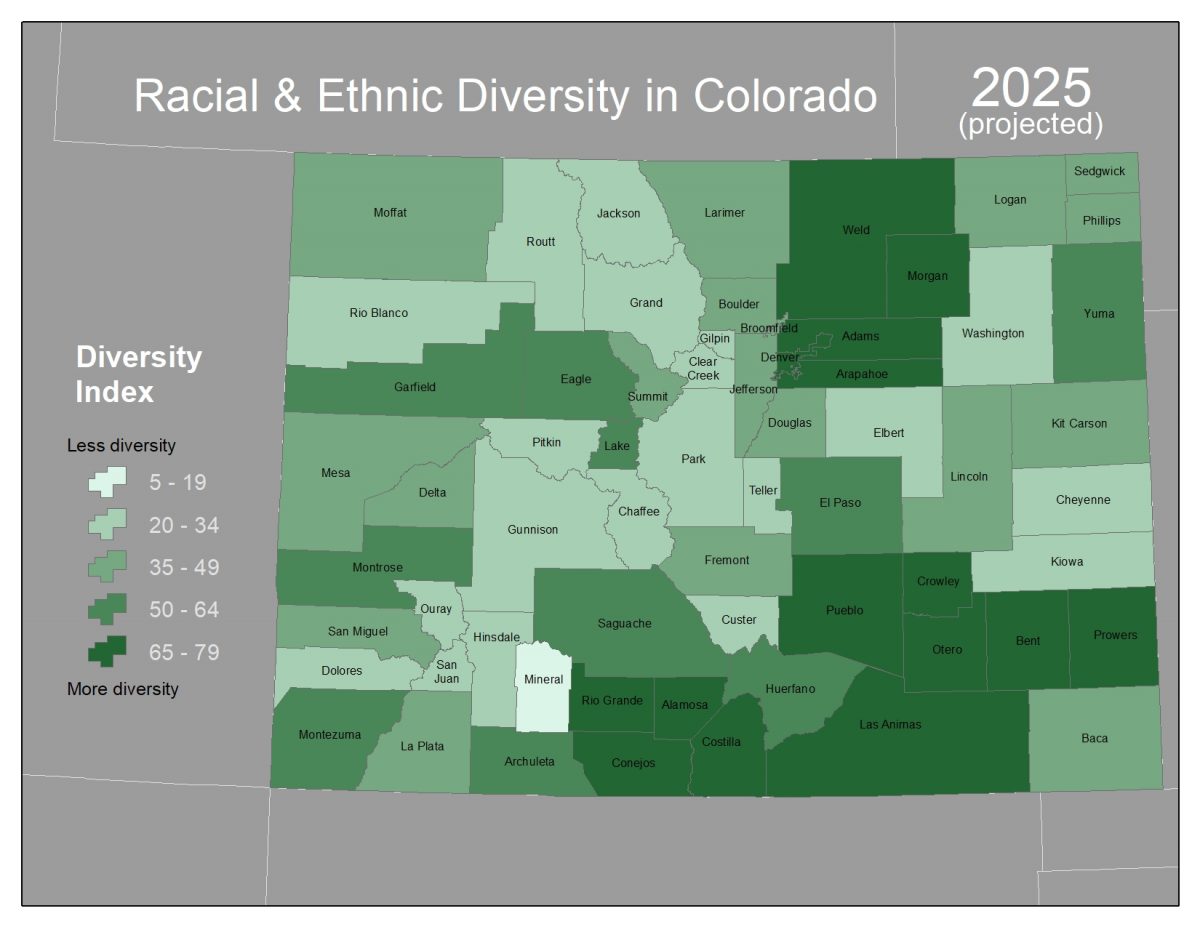
As we look toward the future, will Colorado continue to become more diverse? Based on an analysis of diversity by county, we expect subtle increases in the next five years. The map below shows that San Miguel and Archuleta counties, both in Southwest Colorado, are likely to jump up a tier of the index. Conversely, Lake County is projected to drop down a tier. Note that these projections are only five years out, half the gap compared to the 2010-2020 analysis, so it’s not surprising we see a bit less movement.
Lastly, the table below summarizes the distribution (i.e., lowest, average, and highest scores) of the Diversity Index by year. Supporting findings from the maps above, we see a slight but steady increase in all three statistics across the three years. What surprised me is the counties with the lowest and highest scores are geographically very close together. Mineral County, which was consistently the least diverse, is just a two-hour drive to Costilla County, the most diverse in Colorado.
| Diversity Index Score | 2010 | 2020 | 2025 |
| Lowest | 11 | 16 | 16 |
| Average | 42 | 45 | 47 |
| Highest | 74 | 76 | 77 |
Exploring and understanding our racial and ethnic diversity through the Diversity Index is one way to simply analyze how Colorado is changing. Its insightful, but because racial and ethnic diversity is an incredibly complex and nuanced topic, this type of analysis is just the tip of the iceberg. The reasons and implications of changes in diversity can and should be explored further. The good news is, there are lots of resources for this, here are just a few:
- Shift Research Lab (https://www.shiftresearchlab.org/neighborhood-change): Among many other great resources, Shift tracks how changing demographics and characteristics impact communities, and examine the facets that constitute a Denver area neighborhood.
- Esri’s Racial Equity GIS Hub (https://gis-for-racialequity.hub.arcgis.com/): An ongoing, continuously expanding resource hub to assist organizations working to address racial inequities.
- NorthStar (https://gisnorthstar.org): A community group working to increase representation, belonging, and inclusion of people of African descent in GIS.
- U.S. Census Bureau (https://www.census.gov/): The U.S. Census Bureau is a vast hub for demographic information. Check out the Data Visualization Gallery
- Opportunity Atlas: https://www.opportunityatlas.org): Opportunity Insights, a non-partisan, not-for-profit organization located at Harvard University, developed the Opportunity Atlas, an interactive mapping tool that estimates a child’s chances of climbing the income ladder for over 70,000 neighborhoods across America.