What is NPS?
6/23/20 / David Kennedy

NPS is perhaps the most well-known metric in the world of satisfaction research, but as with many acronyms and jargon, what it actually is sometimes gets lost in translation. So, whether the term is new to you, or you just need a refresher, here is a quick overview of NPS.

What is NPS?
NPS stands for Net Promoter Score. The metric was developed by Fred Reichheld of Bain & Company, and it made its first appearance in a Harvard Business Review (HBR) article back in 2003. There is also a book on the topic. NPS is one of the many ways to capture the voice of the customer.
NPS is a single number and it is that simplicity, at least in part, that has fueled its success. Other metrics may not represent the entire customer relationship in one figure or may need additional work to interpret (though, that nuance can be meaningful).
There is also a claim that it is correlated with revenue growth, making it both easy to understand and a useful KPI (Key Performance Indicator) to track. More on that claim below.
How is it derived?
You may have heard of “The Ultimate Question” and it is this question that is used to derive NPS. In short, you ask:
How likely is it that you would recommend [brand/product/service] to a friend or colleague?
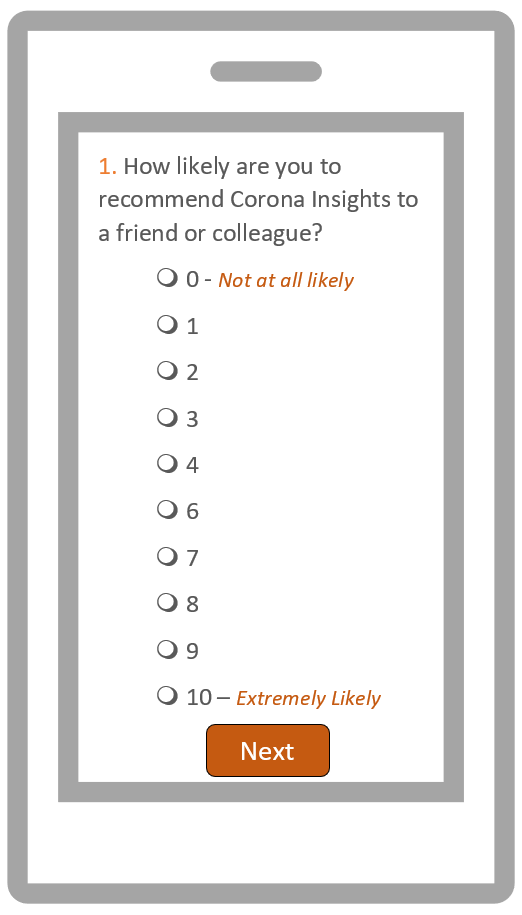
The response option is typically a scale from 0 to 10, where 0 represents “not at all likely” and 10 represents “extremely likely.” Other scales are possible, from 7 point numbered, to 5 or 7 point labeled (e.g., extremely satisfied, moderately satisfied, slightly satisfied, neutral, slightly dissatisfied, etc.), and even a simple yes/no.
Next, you ask why they gave you that score, traditionally in an open-ended question. This allows them to tell you what’s driving their rating in their own words rather than responding to a list of prechosen options. It’s these responses that helps you identify where to focus in order to improve your score.
You then calculate a “net” score. To do so, we subtract the percentage of responses from one part of the scale from the other.
In the case of the typical 0 to 10 scale, the recommendation is to take the percentage of respondents who gave a “9” or “10” – these are your promoters as they are seen as being the most likely to actively promote your business – and subtracting the percentage of respondents who gave a “6” or lower – these are considered detractors as they are seen as being the most likely to actively speak poorly to others about your business. You may think a “6” is still positive, but when correlating it with other responses these do seem to be upset respondents, rather than simply neutral.
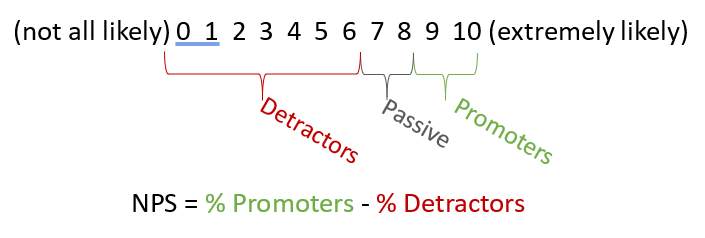
You may be wondering what happened to the “7’s” and “8’s.” This group is called passives and generally are just ho-hum – they don’t love you, they don’t hate you, and for the purpose of this metric: they’re ignored.
How do you interpret NPS? What is a good score?
So, we did the math (NPS = Promoters – Detractors) and have a number. So, what then?
First, it’s good to keep in mind the range of potential scores. If you had 100% of respondents give you a “9” or “10” your NPS would be +100. On the other hand, if 100% give you a “6” or lower, then your NPS would be -100. Therefore, all scores will always fall between -100 and +100.
So, does that mean that anything positive (i.e. above zero) is good? Not necessarily.
What is “good” or “bad” is relative to your industry and competitors. Some industries, such as professional services have a relatively high NPS (in the +50 range) while others can even be negative, on average. Take the airline industry as an example. The industry as a whole has had a negative NPS score in the past, so even being less negative than in the past may still be “good.”
The takeaway is to not focus on the specific number alone, but how it compares to your competitors. (Where can you find competitors’ NPS scores? You could either do the study yourself to compare or sometimes find industry averages published online.)
If you don’t have competitors’ scores, it may still be useful to you as you can track your progress over time, as you can with any customer metrics. For instance, we have seen in tracking studies for clients how scores correlate with operations over time, providing a useful understanding of how changes in such things as reliability impacts customer experience and eventually retention.
Does it really do what it claims to?
Ask any market researcher their opinion of NPS, and you risk being drawn into a lengthy discussion.
There are three common criticisms of NPS:
- It doesn’t actually always do what it claims to do – that is, predict future growth. While the original claims suggested a link between growth and NPS, many subsequent studies have suggested less strong connections between NPS and growth.
- It’s not necessarily better than other satisfaction questions. Other metrics, such as asking satisfaction directly, or likelihood to continue using a specific product/service, often perform as good, if not better than NPS. Which leads to…
- One question isn’t a reliable metric. Using several questions and data points creates a better, more reliable metric to track over time.
So why is it used so broadly? It is, in part, its own popularity that continues to fuel its success. Managers get familiar with it, use it, more people get familiar with it as a result, and the cycle repeats.
And familiarity is a valid reason to use it, in my opinion. If users are comfortable with it, then by all means use what they know and understand if it means they’ll pay attention to it over time.
Simplicity is another likely reason. Averages, “top-box,” and other metrics are often harder to understand for the non-researcher. NPS provides simplicity in a way that is easy to understand – how many more people recommend my product or service than actively recommend against it?
Is it for you?
So, that’s a lot of background on a simple customer feedback metric (CFM).
In the end, there is not necessarily a right or wrong answer here, as long as the decision is made with the relevant background (which hopefully I provided here). As with anything, your mileage may vary and it may take more than one attempt to get it right, so experiment, adjust, and try again until you find a metric(s) and corresponding system that works for your organization.
Oh, and one more cautionary note. Be sure to think through the wording of the question and whether it’s a fit for your product or service. If the product or service would not be one that is “recommended” by another (maybe because it’s the only option or only used in emergencies – think emergency ambulances) then you may want to consider other metrics and wording. Some customers may be frustrated suggesting they had a choice in the first place!
There is so much more we could cover about NPS here – how it’s used in incentivizing employees, to coding the open-ended “why” question – but hopefully this gave you a good foundation for your future NPS work. Corona has conducted many customer satisfaction studies, many utilizing NPS and many not utilizing it, and would love to chat more about whether it’s a fit for your organization. Contact us to continue the conversation!