What is Statistical Significance?
7/8/20 / Jim Pripusich

You may have recently seen the phrase “statistically significant” in an article to note that an occasional glass of red wine can increase life expectancy (let’s hope so) or that your daily coffee intake is causing some kind of malady (worth it). Statistical significance is critical for how we understand important differences in groups and determine whether interventions had effects, but what does it actually mean? How is it determined? When should it be calculated in market research? Whether you haven’t thought about statistical significance since high school stats or see it on a daily basis and just want to make sure you are interpreting it correctly, here is a quick overview of the concept and the tale of the lady tasting tea.
What Does “Statistically Significant” Mean?
In short, statistical significance means that the difference we observe between two groups is unlikely to be attributed to random chance. Note that this tells us nothing about the importance of this difference. In fact, many statistically significant findings are trivial in terms of their actual importance. Why do we compare differences to random chance? How do we determine if a difference is distinct from random chance? Let’s talk tea.
The Lady Tasting Tea

The story goes that Ronald Aylmer Fisher was at a party in Cambridge, England in the early 1900s. A woman claimed that she could taste the difference between a cup of tea where milk was added to tea and a cup of tea where tea was added to milk. Fisher proposed an experiment where eight cups were randomly assembled, four with tea poured first, and four with milk poured first. The lady must then taste the poured tea and identify four cups where tea was poured first.
How many correct identifications would prove the lady’s claim? Is three out of four enough? Fisher proposed starting by understanding the full possible combination of guesses. For example, there is just one possible combination where the lady would get them all correct. There are, however, 16 potential combinations of guesses and cups where she would correctly guess three out of four. In total, there are 70 potential outcomes of guesses and cups.
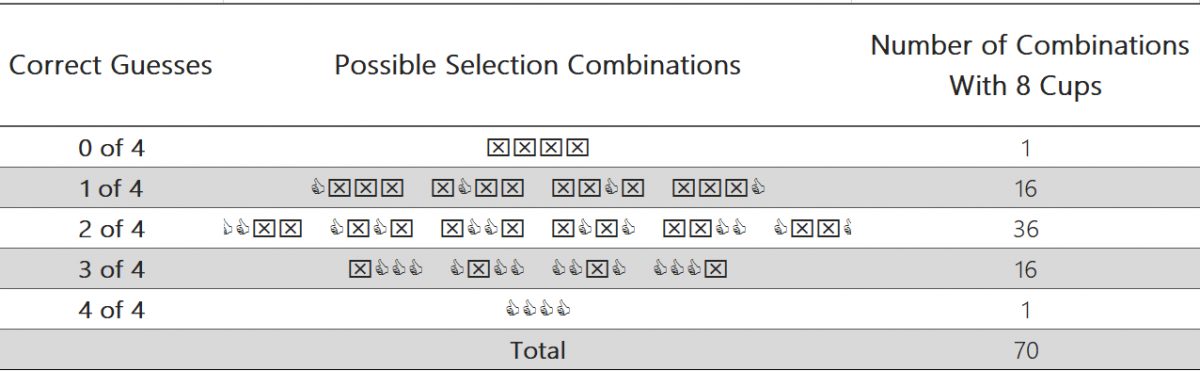
So, what does all of this mean? The logic is that if we were to flip a coin for our guess, rather than relying on the lady’s expert palate, we would be most likely to guess two of the cups correctly, as this outcome in some combination comprises 36 of the 70 outcomes, or 51%. So, is three out of four right enough? Fisher calculated that there was a 24% probability of getting at least three of four cups correct. If another partygoer were to have picked the four cups that looked the shiniest, she would have gotten three out of four of the tea-poured-first cups a quarter of the time. This would not be sufficient enough for Fisher to not rule out random luck or chance driving the three correct guesses.
Luckily, the lady was up to the task and identified four out of four cups correctly. Fisher noted that there was only one outcome of the 70 that met this criteria, leading to this event having a 1.4% probability. This was good enough for Fisher, who had somewhat arbitrarily chosen 5% as a working critical value. Anything less than a 1 in 20 chance was rare enough to be unlikely to occur randomly. This standard remains the most commonly accepted cutoff in scientific work today. However, it is important to remember that it is indeed arbitrary, and that something that is statistically significant at the 5% level simply means that it would happen by chance 5% or less of the time. For a more detailed description of Fisher’s theories and the broader impact of statistics on science read David Salsburg’s The Lady Tasting Tea.
Statistical Significance in Market Research
When should one use a test to determine statistical significance in market research? Anytime we want to know if a difference between two groups/values is due to random chance. Most of the time, when we survey a population, we are drawing inferences from a smaller sample. Running a statistical test like a t-test can tell us, for example, if higher rates of voter turnout amongst higher educated individuals is likely to be a characteristic of the broader population, or if it is simply a random artifact of our sample.
We call this hypothesis testing. When we use stats to test hypotheses, we are not trying to confirm our expectation that a difference across groups exists in the population, but rather simply reject the null hypothesis that the two groups hold the same value (i.e. that education level has no impact on an individual’s likelihood to vote). If we think that there is less than a 5% probability that the difference happened by random chance, we reject the claim that the two groups hold the same value.
While Fisher’s exact test looks into all the potential outcomes to determine this, t-tests and most other common statistical tests calculate the probability of observing a difference by chance with inputs like the sample size and the variance of the data. If we want to know if some intervention, like an afterschool program, had a significant effect on some outcome, like literacy rates, we could compare pre and post rates from a treatment group and a control group. If the treatment group demonstrated a greater increase in literacy rates, with a large enough sample size and low enough variance, we can say that there is a statistically significant effect of the intervention.
Again, finding statistical significance is not a panacea when it comes to supporting evidence. In addition to making sure we are meeting various assumptions, sampling correctly, and avoiding measurement error, we need good theory and background to know if the observed difference is substantively meaningful and important. Finding statistical significance is just the start of a conversation in market research, but it is often a necessary step to avoid drawing conclusions from differences that were likely to be simply the product of random chance.
This discussion only scratches the surface of statistical significance and its role in market research. At Corona, we have a whole team of folks ready to nerd out to help you with any questions or applications you might have about stats or hypothesis testing. Contact us to continue the conversation!