The Race to the Rockies – Colorado Migration Part 1
7/22/16 / Greg Hornback
I admit, I am one of many in the horde of people who have recently migrated to Colorado. Indeed, there are tens of thousands of us moving here each year at one of the highest rates in the country. But who really is “us”? Who are the people moving into Colorado in droves? This blog will be part 1 of a 2-part blog series exploring who is moving into Colorado. In this first blog, we’ll be looking at generational migration patterns over time and migration by race and ethnicity.
Generational Movement in Colorado
Utilizing the Census Bureau’s Population Estimates for 2010 to 2015, I broke this question down by two basic demographics, age and sex. In the following graph, generations were grouped roughly using Pew Research Center’s definition for each generation.1 Each generation has net migration (those moving to Colorado minus those who left) graphed from 2011 through 2015.
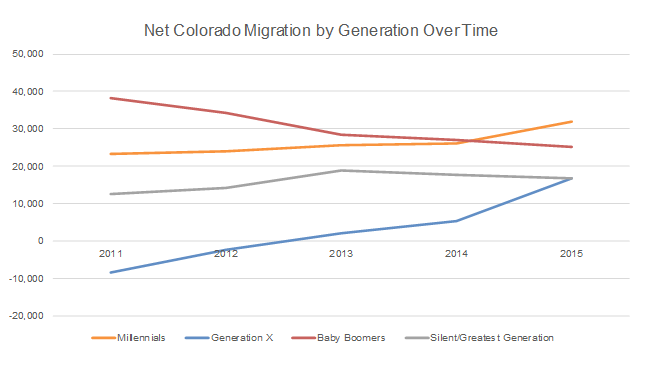
Unsurprisingly, we see that net migration has been positive for each generation since 2013. Most recently, each generation in Colorado had a net positive increase of 16,000 or more. Millennials have been moving in at the highest rate, with over 30,000 having moved into Colorado between 2014 and 2015. Baby Boomers also prefer moving into Colorado rather than out, with a net migration over 25,000.
As a non-native, what I find most interesting is how this has changed over time. From 2010 to 2012 we see more Generation Xers moving out of Colorado, with a net migration loss of nearly 10,000 having left the state in 2011. It wasn’t until 2013 where we saw more moving in, with a large uptick (over 10,000 more) in 2015. Also unexpected was the increase of nearly 40,000 Baby Boomers that occurred in 2011.
Millennials, on the other hand, have been consistently moving into Colorado, with 2015 seeing a strong increase in the number moving into the state. They are also the only generation which show a substantial difference between genders, with about 4,000 more males moving into Colorado than females in 2015. Needless to say, as a male Millennial who has moved into Colorado, I am thankful to already be married.
Race and Ethnicity Movement in Colorado
Using the same data source (Population Estimates), I looked at those moving into Colorado from 2010 to 2015 by race and Hispanic/non-Hispanic ethnicity.
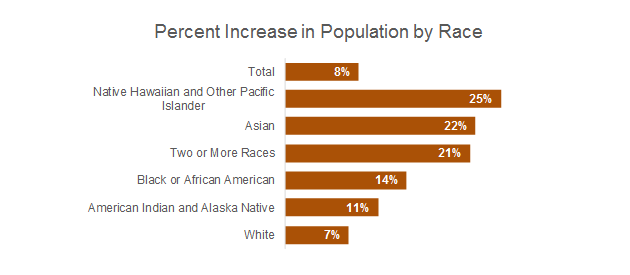
The total percentage change in population from 2010 to 2015 was 8.5%, making Colorado the third ranking state by population growth rate since 2010. When looking at percentages, many Native Hawaiian and Other Pacific Islanders appear to be moving into the state, though 2015 saw an increase of only about 2,000 since 2010. Many Asians have also been moving into the state, with there being a 22 percent increase equating about 30,000 new residents. Those who identify as multi-racial have moved into Colorado at similar numbers.
Colorado also has a large Hispanic population. In fact, we are one of nine states that have a Hispanic population of over 1 million. Between 2010 and 2015, we saw an increase in Hispanic population of just over 12 percent, with an additional 125,000. The Hispanic population currently represents approximately 21% of Colorado’s total population.
Now that we have a better idea of the age, race, and ethnicity of those moving into Colorado, we can get a better idea of some of the characteristics behind our newest residents. In my second and final blog on the topic, I will explore these various characteristics to help complete the picture of these new Coloradans.
1 Due to the data available in the Population Estimates tables, some generations in the graph includes ages +/- 1 or 2 years from Pew’s definition, and the Silent Generation was combined with the Greatest Generation. The graph also doesn’t include those 19 and younger, though the age cutoff between Millennials and the following generation has not yet been determined.