Navigating Time and Space: Why we Include Geography
9/29/15 / Matt Bruce

When I was a kid living in Colorado Springs, my family frequently drove to Denver. We would go to watch baseball games or visit museums. It is about 60 miles between Colorado Springs and Denver. Back then, the speed limit was 60 to 65 miles per hour, and I had fun mentally calculating that since our Jeep was traveling about one mile per minute, then we would reach Denver in about one hour. Of course, this was all before the electronic geographic information revolution.
These days, we can quickly discover the distance from one place to another with just a few clicks on Google Maps or onboard GPS devices, and there are numerous software programs that calculate typical drive, bike or walk times.
Here at Corona, we leverage these geographic information technologies for many of our research projects when we suspect that there is a spatial (i.e., geographic) relationship with our key variables. In other words, knowing the distance or travel time between two locations can reveal key insights. For example, let’s say the Colorado Rockies baseball team wanted us to survey fans living in the Metro Area to understand what barriers prevent them from traveling to Coors Field to watch a game. Our analysis would likely explore their opinions about going to a game (e.g., are tickets well priced, are games played at convenient times, etc), but we might expect that these opinions are influenced, in part, on the distance or travel time between their home and the ballpark. Fans living far away from the ballpark might have stronger convenience barriers than fans living closer to the ballpark.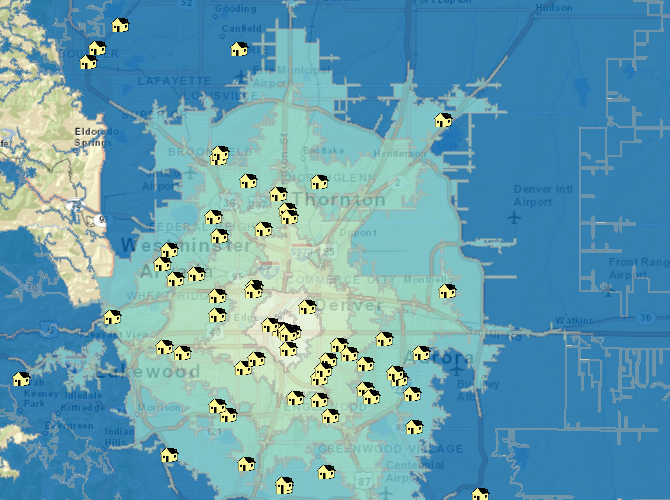
To explore this hypothesis, we can use GIS software to plot survey respondents’ homes. Then we decide to analyze by distance or by travel time. This choice depends on the research question we are trying to answer, as well as the context of the research. In a study of opinions about sound or light pollution, analyzing distance clearly makes more sense. If a behavior of interest involves walking or biking, then distance might be more important than travel time, considering walking 100 miles is a significant feat, but people frequently travel that distance by car. Alternatively, a study in a city where all the streets are linear and the speed limits are the same, drive time would be directly related to distance, so the unit of measurement wouldn’t matter. However, in many of our projects, such as the Coors Field example, we are most interested in drive time. Using drive times has a big advantage when the transportation system is not linear, which is often the case due to interstate highways, bridges, mountains, canyons, no-travel zones, construction, and a host of other reasons. Considering drive time during rush hour is likely longer than an early weekend morning, our software allows us to specify a drive time to the day and hour.
So how does including geographic data benefit analysis and improve insights? Most simply, we create custom segments based on distance, and we create easy-to-understand graphs that cross results to other questions by this variable. Segmentation is a good start, but we rarely stop there. On many projects, the research demands more rigorous results, in which cases we will convert the data so that we can apply a more advanced analyses that tells us the strength of relationships to other key variables. For example, we can find out the extent that drive time to Coors field predicts fans’ perceived barrier to going there for a game. In fact, we can explore multiple variables (e.g., ticket prices, fan devotion, and drive time) simultaneously to reveal patterns that would otherwise be difficult to tease apart. In some cases, we calculate drive times to other site, such as other leisure attractions. We then incorporate that data to the analyses so that the results more closely reflect the real world, where decisions on how to spend leisure time are more complex.
While geography won’t provided all of the answers to our research questions, distance and drive time can be a key variable that helps explain what’s going on. By using geographic technologies, we can efficiently explore this variable and sharpen our findings and recommendations. In other words, it helps us paint a more complete picture.
Send us an email if you would like to discuss how analyzing spatial patterns could help answer your most important questions.