The Sports Category – The second in a series of posts analyzing Trivia Crack
4/28/15 / Kevin Raines

A Study of Trivia Crack Scoring
In our series of analyzing knowledge about knowledge, we first talked about scoring patterns in the Science category of Trivia Crack. Today we’ll move on to Part 2, where we examine the exciting world of sports trivia.
We gathered and analyzed the scores of over 400 random Trivia Crack players by participating in both one and one and group challenges. Here’s the distribution of scores that we developed.
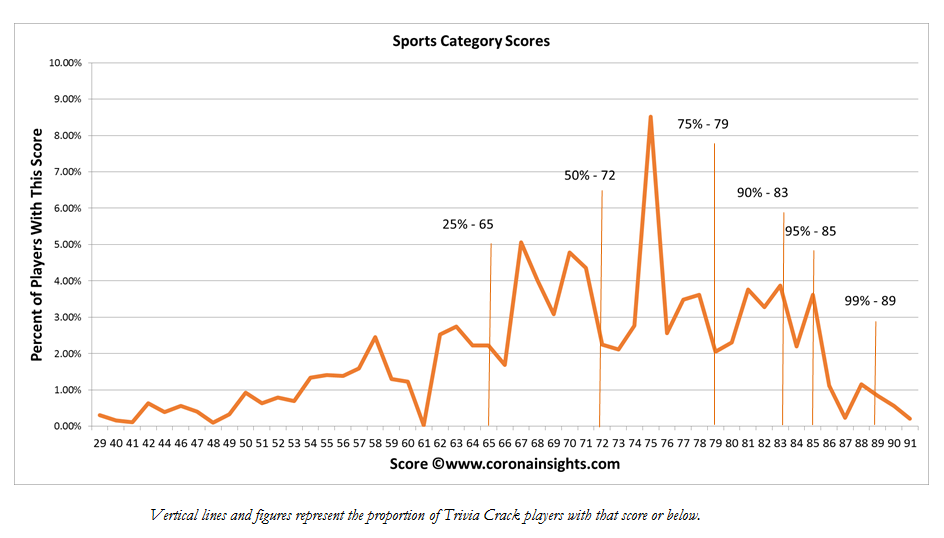
So half of all Trivia Crack players have a score of 72 or higher in Sports, which is the same median that we saw earlier with Science. But other than that, the pattern is quite different. We have a lot of people who aren’t strong at sports, so you can break out of the bottom 25 percent with a slightly lower score than in Science, but there are a lot of people who are really, really good at sports. To break into the top 10 percent you need a score of 83, and the top 1 percent requires a sky-high score of 89. Whereas an 85 will get you into the top 1 percent in Science, it’ll only get you into the top 5 percent in Sports.
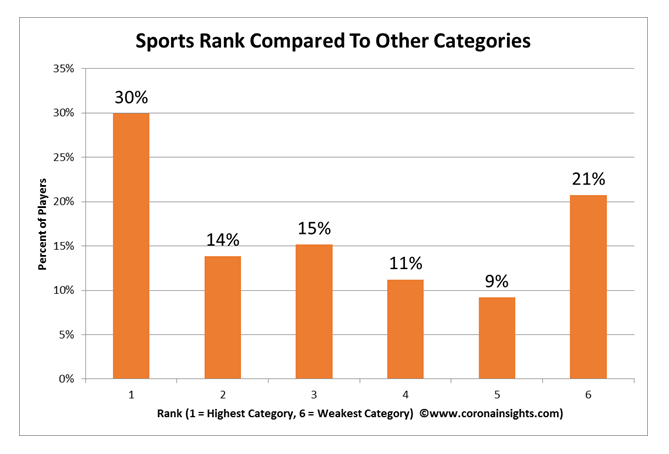
Since we have more people who are particularly strong at sports and more who are particularly weak, where does the Sports category stand in terms of rankings? As you might expect, it follows a very atypical pattern. A full 30 percent of Trivia Crack players have Sports as their best category, but for 21 percent it’s their weakest. Sports is a boom or bust category for players. Overall, Sports is the fourth-highest category for players.
If you’re good at Sports, does that predict that you’re a good overall player? And if you’re weak at Sports, are there other categories where you’re strong or weak? We did a correlation to test that analysis. We won’t reveal our analysis of total scores until later – you know, to build up suspense – but we can look at correlations.
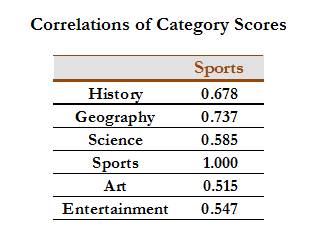
First off, we should note that there’s a strong correlation between every category and total score. We would expect that, because your total score is just the sum of all of your individual category scores. However, there’s a stronger correlation in some categories than others, and Sports is one of the least powerful as a predictor of overall score. It’s still strong, with a Correlation factor of 0.791, where 0 means no relationship at all and 1 means that it’s a perfect predictor. However, it’s only the fifth-highest among the six categories. Our theory is pretty straightforward on this one: there are a lot of people who really know sports, but aren’t as strong at other categories, and there are also a lot of people who know little about sports but are well-versed in other categories.
And what category most closely aligns with Sports? Another simple correlation analysis shows that the scores that run most closely in parallel to Sports scoring is Geography scoring. Maybe it has something to do with spatial reasoning or something. If you like watching a ball in the air, you also tend to know the capital of Romania. On the other hand, Sports scoring correlates least well with Arts, so it’s probably not a great idea to discuss Impressionism with the person sitting next to you at a Cubs game.
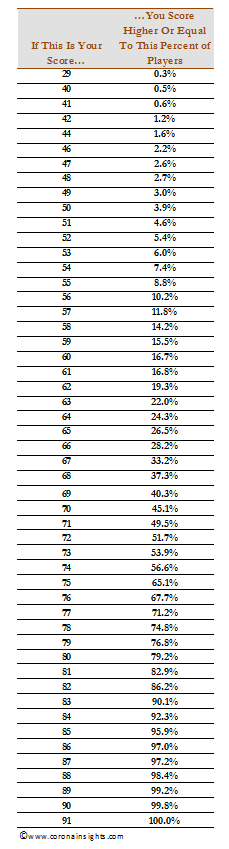
If you’d like to know exactly where you stand on Sports, here’s a chart that estimates the proportion of players who score at or above a particular score, based on our modeling.
Now it’s time to check out our next post examining geography trivia.
- Previous Post / The Geography Category – The third in a series of posts analyzing Trivia Crack
- Knowledge About Knowledge – Trivia Crack Evaluation Measures / Next Post
Your statistics are wrong. No one can have a higher score than 100% of the players if he is also ONE OF THE PLAYERS!
Hi Bryan,
Yes, agreed. Our scoring system measures the proportion of players where you score equal to or greater than. It’s technically not a percentile measurement, but it was the easiest way to handle the figures.