Subpopulations in Research
12/27/16 / Greg Hornback
As I’m sure you know, we do a lot of survey research here at Corona. When we provide the results, we try to build the most complete picture for our clients, and that means looking at the data from every which way possible. One of the most effective ways to do this is by looking at subpopulations.
What is a subpopulation?
A subpopulation is essentially a fraction or part of the overall pool of the population you are surveying. A subpopulation can be defined many ways. For example, some of the most common subpopulations to examine in research are gender (e.g. male and female), age (e.g. <35, 35-54, 55+), race/ethnicity, location, etc. You can effectively define a subpopulation using whatever criteria you like; for instance, you can have a subpopulation that is based on what type of dessert is preferred – those who like cake and heathens those who don’t like cake.
What does it mean to have subpopulations?
When you examine survey results by subpopulations, at a basic level respondents are simply split into the subpopulations or groups (commonly called breakouts) you defined. After being broken into these groups, the results for the survey are compiled for each individual group separately. For example, take the following survey question:
- About how many hours a week do you watch sports?
- 1 hour or less
- 2 to 4 hours
- 5 to 7 hours
- 8 hours or more
The results would typically have two components: top-level results (results compiled for all respondents to the survey) and breakouts (results by group for any subpopulations that have been defined). For the above example question, the results might look something like this:
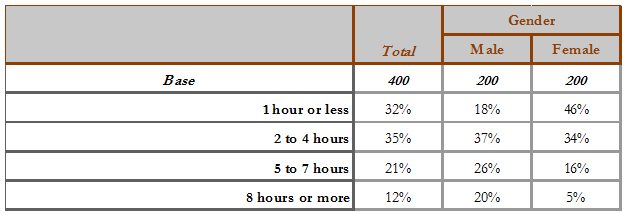
In this completely made-up example, you can see the benefit of having subpopulations. While 21 percent of overall respondents watched five to seven hours of sports a week, you can see that male respondents accounted for a hefty chunk, as 26 percent of males watch that much sports, compared to only 16 percent of females. Breaking out questions by subpopulations allows you to more closely examine data and assists in finding those gems of information.
Getting the most out of your survey
Being prepared to utilize subpopulations in your survey analysis means putting your best foot forward and maximizing your investment. Many subpopulations are constructed using questions commonly asked in surveys (gender, age, etc.), but some questions might not otherwise be asked without the foresight of planning to break respondents into subpopulations. For example, a nonprofit might be building a questionnaire to survey their patrons on their messaging; by simply asking if a respondent has donated to the organization, they can examine survey results of donors separately from all patrons. The survey can now not only better inform messaging for the organization overall, but also allows them to better target and communicate to donors, specifically.
Conducting a survey can be a challenging experience, so the more you can get out of a single survey, the better. The next time you are designing a survey, ask around your workplace to see if a few questions can be added to better utilize the information you’re collecting. Now you’re one step closer to conducting the perfect survey!