Tracking H2O
6/11/15 / Matt Bruce

As a skiing and a river rafting enthusiast, I’m interested in snow levels of our nearby Rocky Mountains and of water levels in our creeks and rivers. Early summer is therefore an exciting time to monitor snowpack and river levels because changes are dramatic. Luckily, two websites provide current data on snowpack and river levels that illustrate data in interesting ways.
To understand snowpack levels, I surf over to the National Resource Conservation Service (NRCS) SNOTEL website, which tracks snowpack across eight watersheds in Colorado. This website is easy to use and the data is updated about every four to six days.
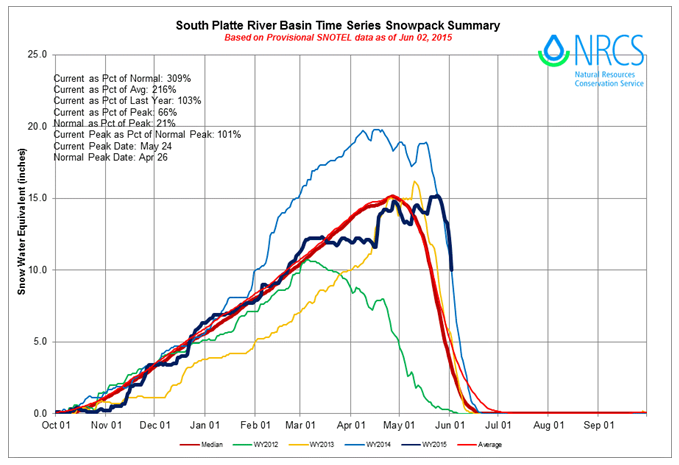
Since I live in the South Platte River Basin, I frequently check out our time series snowpack summary, which displays snowpack estimates for the current year as well as the previous three years. As you can see below, the average and median (called normal) snowpack levels (red lines) are close to identical. Looking at these lines, you can see that May 1st is a typical “tipping point” that leads to a downward melting trend.
We bucked the trend in 2015. This year (dark blue line) was pretty close to normal until March when we went through a six-week dry spell. Storms and cool weather in April and May helped pull the snowpack upwards until we peaked on May 24, which is about a month after our normal peak day. Although we are now sliding into snowmelt season, you can see that our current snowpack, as a percent, is 309% greater than a normal year.
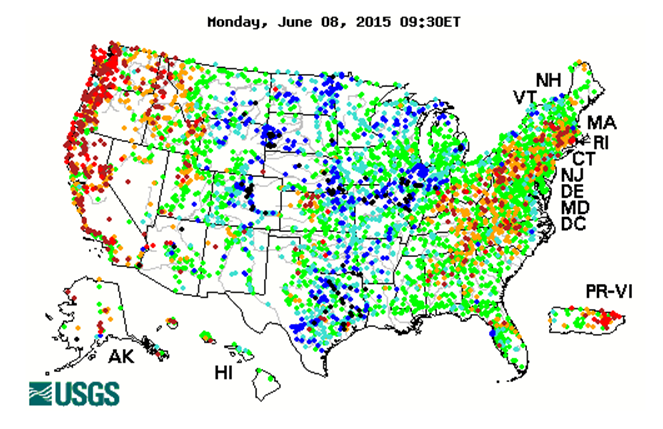
After looking at our snowpack levels, I frequently cruise over to the United States Geological Survey (USGS) Water Information System website, which tracks real-time water levels in rivers and creeks nationwide. Their top-level map depicts river and creek water levels as a percentile of that day over a 30-year average. Just as any good data-driven exhibit should do, their national map makes it easy to see major trends and patterns. Rivers in the Pacific Coast states are very low, with many running below the 10th percentile. The Great Plains states have experienced a very wet spring and early summer, and rivers here are generally running very high compared to normal. The Appalachia and Atlantic Coast rivers are normal or low.
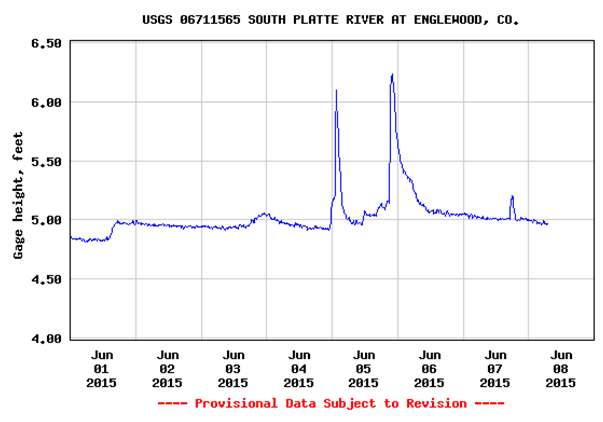
Zooming into the Denver area, we see our river levels are very high, with most above the 90th percentile. By clicking on a dot (which represent water level gauges), you can get information about a specific sites. For example, the chart below shows water levels of the South Platte River in Englewood, CO, a suburb of Denver. You can see two steep spikes on June 5th, one in the early morning and one in the evening, that were caused by strong storms. Evidence of the first storm was obvious to the residents in Southeast Denver, who woke up that morning to the sound of front-end loaders moving four feet of hail off their streets.
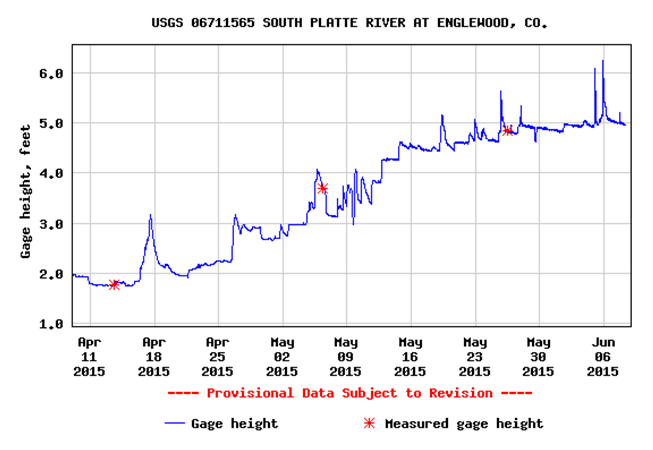
While the June 5th spikes are related to localized rainstorms, the melting snowpack is also influencing water levels. If we extend the graph from seven days to 60 days, we see that water levels have consistently climbed since early April, due to spring rainstorms and melting snowpack. The spikes of June 5th, which looked so dramatic in the top graph, become just one of many steep spikes the river has seen in the past couple of months.
So who cares about all this anyway? Well, you might care if you operate a tourism business in Colorado. For example, organizers of running races scheduled to take place in the high mountains changed their routes due to snow covered trails, and two popular driving roads, Trail Ridge Road in Rocky Mountain National Park and Mt. Evans Road in the Arapahoe-Roosevelt National Forest, were both closed over Memorial Day weekend (their traditional opening day). Besides the recreation and tourism industry, other professionals such as utility managers, city planners, emergency respondents, water companies, and farmers all depend on snowpack and river levels. While Coloradoans will continue to experience wild weather, these two websites can help us all understand and react to it.
Great stuff, Matt. I too follow those same resources. Nice job of putting it all together with clear explanations!