Beyond the logic model: Improve program outcomes by mapping causes of success and failure
8/24/16 / Beth Mulligan

Logic modeling is common in evaluation work, but did you know there are a variety of other tools that can help visualize important program elements and improve planning to ensure success?
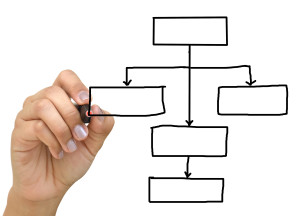 One such tool is success mapping. A success map can be used to outline the steps needed to implement a successful program. It can also be used to outline the steps needed to accomplish a particular program improvement. In a success map the steps are specific activities and events to accomplish, and arrows between steps indicate the sequence of activities, in a flow chart style. Compared to a logic model, a success map puts more emphasis on each step of implementation that must occur to ensure that the program is a success. This can help the program team ensure that responsibilities, timelines, and other resources are assigned to all of the needed tasks.
A related tool, called fault tree analysis, takes an inverse approach to the success map. Fault tree analysis starts with a description of an undesirable event (e.g., the program fails to achieve its intended outcome), and then reverse engineers the causal chains that could lead to that failure. For example, a program may fail to achieve intended outcomes if any one of several components fails (e.g., failure to recruit participants, failure to implement the program as planned, failure of the program design, etc.). Step-by-step, a fault tree analysis backs out the reasons that particular lines of failure could occur. This analysis provides a systematic way for the program team to think about which failures are most likely and then to identify steps they can take to reduce the risk of those things occurring.
These are just two of many tools that can help program teams ensure success. Do you have other favorite tools to use?