The Entertainment Category – The fifth in a series of posts analyzing Trivia Crack
5/7/15 / Kevin Raines

In our series of analyzing knowledge about knowledge, we’ve previously talked about scoring patterns in the Science, Sports, and Geography categories of Trivia Crack, as well as the methodology of collecting our data. Today we’ll move on to Part 5 of our series, where we examine Entertainment scores.
We gathered and analyzed the scores of over 400 random Trivia Crack players by participating in both one and one and group challenges. Here’s the distribution of scores that we developed.
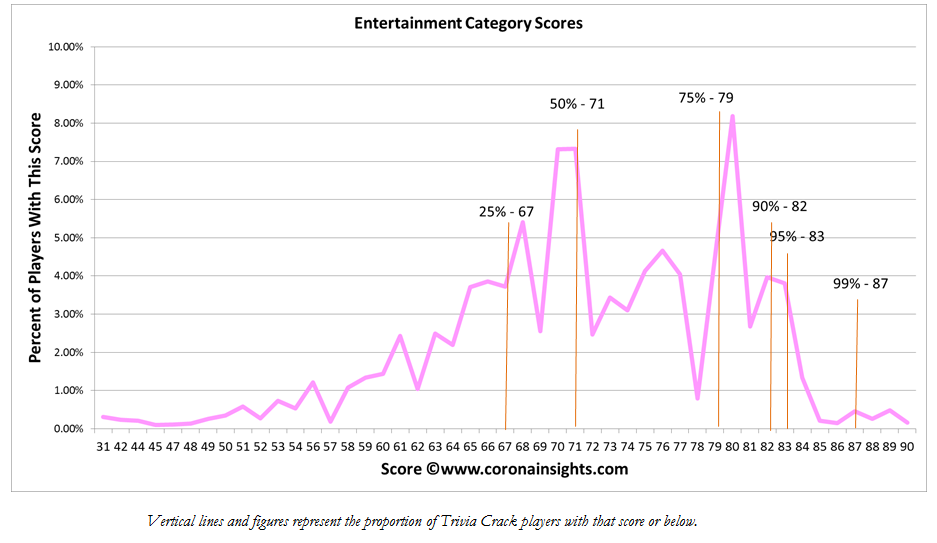
A score of 71 will put you in the top half of Entertainment contestants, which is lower than the 72 that we’ve seen in other categories. But you need a 79 to break the 75th percentile, which is higher than most of the other categories we’ve seen so. And an 87 will put you in the top 1 percent.
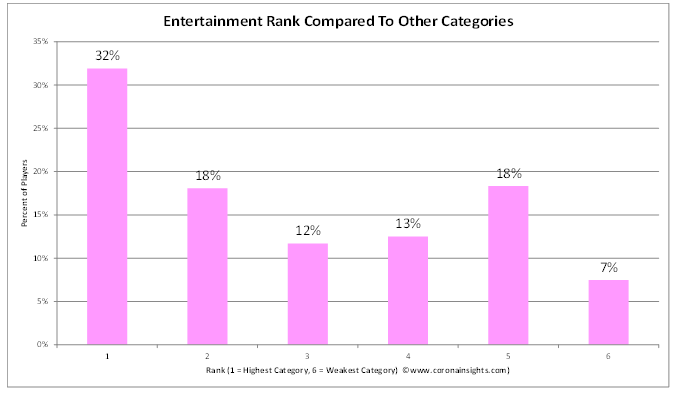
Entertainment therefore produces a very unusual pattern. As seen below, Entertainment is quite often a player’s top category – a full 31 percent are at their best with entertainment questions. On average, entertainment is the second strongest category, trailing only geography, but for very different reasons.
Geography ranks high because it’s very seldom a person’s weakest category, but Entertainment ranks high because it’s quite often a person’s strongest category, even though there’s a large group of people for whom it’s ranked 5th or 6th.
If you’re good at Entertainment, does that predict that you’re a good overall player? And if you’re weak at Entertainment, are there other categories where you’re strong or weak? We did a correlation to test that analysis. We won’t reveal our analysis of total scores until later – you know, to build up suspense – but we can look at correlations.
First off, we should note that there’s a strong correlation between every category and total score. We would expect that, because your total score is just the sum of all of your individual category scores. However, there’s a stronger correlation in some categories than others, and Entertainment is the weakest category as a predictor of overall score. It has a Correlation factor of 0.774, where 0 means no relationship at all and 1 means that it’s a perfect predictor. This is still strong, but compared to the other categories we see that there are a lot of people who either “specialize” in Entertainment knowledge or it’s their Achilles Heel.
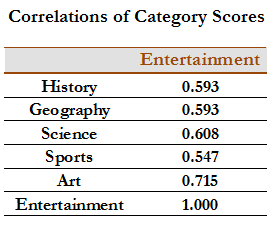
And what category most closely aligns with Entertainment? Another simple correlation analysis shows that the scores that run most closely in parallel to Entertainment scoring is Arts scoring, and for the most part there’s not much correlation with other categories. Our Entertainment experts tend to be out on an island.
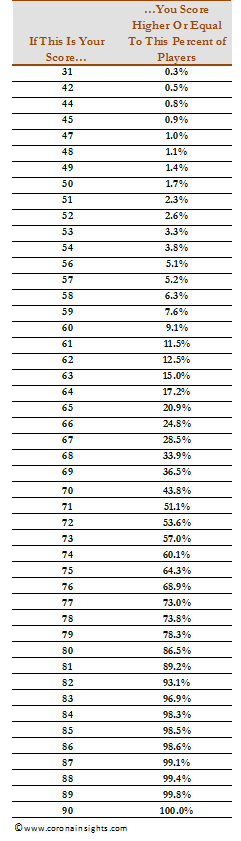
If you’d like to know exactly where you stand on Entertainment, here’s a chart that estimates the proportion of players who score at or above a particular score, based on our modeling.