Measuring Trivia Crack Scores – The fourth in a series of posts analyzing Trivia Crack
5/6/15 / Kevin Raines

If you have been following our series of Trivia Crack scoring analyses, you may be wondering how we developed our estimates. It’s actually an interesting process, and it plays into our strengths here at Corona Insights, of measuring a population when we can only gather data for a sample. So let’s take a quick break from the scoring analyses and talk a little about how we did it.
The Challenges of Measuring
Trivia Crack offers six scores for each player, one each for history, geography, science, sports, arts, and entertainment. Scores range from 0 to 100, and reflect the percentage of questions that a person has answered correctly. We can also calculate a total score by adding the six scores together.
However, it’s not that easy. We don’t have access to the master database, and there are four big challenges in measuring scores if your only way of gathering data is by playing the game.
- First, Trivia Crack provides scores for individuals, but doesn’t provide scores for the whole population. So we had to sample the population by playing games against random opponents. Lots and lots of games against random opponents. We gathered data for 432 opponents, which meant that we had access to the answering patterns for more than 440,000 questions. That part was pretty fun.
- Second, Trivia Crack is actually two similar games. There’s a one on one matchup against a single random opponent, and there are challenge matches where you play against nine opponents at once. It’s easier to sample data in the challenge matches because you gather data nine times faster. But are the players and scores different?
- Third, we have a classic statistical problem of sample sizes and variance. If you only answer 1 question, it’s pretty easy to get a score of 100. If you answer 10, it’s more difficult. If you answer 1,000, it’s almost impossible. So we needed to be sure that our analysis wasn’t tainted by this fact.
- And finally, there’s a subtle but important complication. If you start a game and select a random opponent, you’re more likely to draw a person who plays often and has answered more questions. So when we start a game and randomly draw an opponent, we’re not drawing a true sample of players. We’re overrepresenting players who play more often. Those players may have higher scores because they’re good at the game and having fun, or they may have lower scores because it’s hard to maintain consistent high scores over time. We have to figure this out and statistically correct for it if it turns out that scores are higher or lower for more frequent players.
So How Did We Measure?
First off, we played a lot of games, always against random opponents, and then we entered their scores into a database. That part was easy. We also set a rule that we would not include a person’s score in the analysis if they hadn’t answered at least 300 questions. While somewhat arbitrary as a threshold, this requirement eliminated a lot of the random variation that comes when people answer only a few questions. We eventually gathered data on 392 players, which was enough to do a strong analysis.
The statistical corrections were a little more complicated. First, we tackled the issue of the two types of games. We gathered from both group challenges and individual matchups, and found that there is indeed a difference in scoring. Players in challenge matches tend to have lower scores, possibly because there’s a time pressure in challenge matches that doesn’t exist in one on one matches. So we made some statistical corrections to assume that a player splits his or her time evenly between challenge matches and one on one matches.
The last correction is a little more complex. We did an analysis and found out that the most frequent players tend to have higher scores. In general, every 1,000 questions answered equates to about a 1 point gain in each of the categories, or 6 points in total. This can throw our numbers off because we’re more likely to encounter high-frequency players when we draw a random opponent, which will then overestimate the scoring of a typical player.
To correct for this, we statistically weighted our data to account for the fact that more frequent players are overrepresented. The scores of each player in our database were weighted according to the inverse of the number of questions they’d answered in their Trivia Crack career. Players who have answered more questions are more likely to be randomly drawn because they play more often, so we weighted them down in inverse proportion to the number of questions they have answered over time.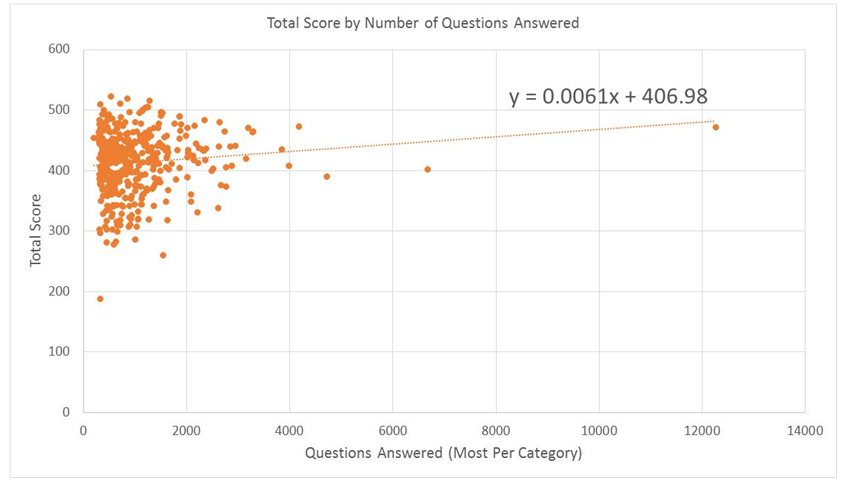
In summary, it’s a more complicated analysis than simply drawing random opponents and looking at their scores. But we developed some systems to do these corrections, and that made the process easier. And by the way, kudos to the fellow in our sample who had answered over 12,000 questions per category.
One thing you will notice in all of the category analyses is a bit of a jagged pattern – a sawtooth. We figure that those would smooth out if we gathered information on a lot more scores, but hey, we have to earn a living. We can’t just be playing games all day.
So enough about methodology. Let’s get back to the scoring.
Check out our next scoring analysis, the fun topic of Entertainment questions.
- Previous Post / The Entertainment Category – The fifth in a series of posts analyzing Trivia Crack
- The Geography Category – The third in a series of posts analyzing Trivia Crack / Next Post
There’s another subtle problem. When the game matches you up with opponents, it does not appear to do so entirely randomly.
A few months ago, when I gathered some data to satisfy my own curiosity, I found that my opponents in friends challenges had a collective won/lost record in challenges that was much, much higher than the 1/10 ratio that one would expect from a truly random sample. Their record in head to head matchups was also well above .500.
I believe that T.C.’s matching algorithm has a bias towards matching players of similar level. Since terrible players are unlikely to continue playing a game where they consistently get slaughtered, higher level players will tend towards being from the better end of the newbie pool.
You might get some subtly different results testing with a higher or lower level account.
Interesting point. I was curious about this myself, but had no real way to test it. I assumed that it was a random draw because I had a large number of games under my belt and would see new players somewhat frequently. As noted in the methodology post, I also corrected in this analysis for the fact that even a random draw will disproportionately produce more matchups against frequent players.
Since conducting this analysis, I’ve noticed a very marked decrease in my matchups against new players and a very marked increase in my matchups against both established players and against very strong players. (I’ll humbly note that I fall into the ‘very strong’ range.)
There are a number of possible reasons for this change. It’s possible that the matchup algorithm has changed in precisely the way you’ve theorized. It’s also possible that the game has expanded broadly enough that the proportion of established players to new players has tilted. Frankly, I’ve also wondered if cheating has become more common, because I’ve seen far more high scoring people than I did when I was collecting this data. What’s your take on these theories?
Why can’t get my other trivia crack game back on level 191